
Figure 2. Characterization of the H3D/H3H strain.
(A) Mononucleosomes prepared from both the cells expressing Myc-tagged H3 (ZL38) and the cells expressing untagged H3 (LHT001) were mixed (Myc-H3 +H3) and immunoprecipitated with the anti-Myc antibody. The same immunoprecipitation (IP) assay was performed with mononucleosomes from strains bearing Myc-H3L130H/H3A110D (Myc-H3H/H3D) and Myc-H3A110D/H3L130H (Myc-H3D/H3H). The precipitated mononucleosomes were denatured and examined by western blotting with both anti-Myc (Myc) and anti-histone H3 N-terminal antibodies (H3N). (B) Chromatin IP (ChIP) analysis was performed in Myc-H3A110D/H3L130H (Myc-H3D/H3H) and Myc-H3L130H/H3A110D (Myc-H3H/H3D) cells using anti-Myc antibody. The precipitated DNA was analyzed by qRT-PCR with primers specific for the GAL1-10 gene promoter and normalized to the ACT1 gene. Error bars indicate s.e.m. for three independent experiments. (C) MNase digestion of nuclei from WT (LHT001) and H3D/H3H strains. Nuclei were digested with increasing concentrations of MNase for 4 min. MNase cleavage sites were mapped from the EcoRI site within GAL10 by indirect end labeling analysis on a 1.6% agarose gel. Marker fragments are from PCR products of 1 kb and 500 bp in length. The UAS region and nucleosome positions are schematically shown on the right. ND, naked DNA. (D) Dotting assays were performed in H3D/H3H mutant and WT (LHT001) cells. Plates were photographed after incubation at 37°C, 30°C and 23°C on yeast extract peptone dextrose (YPD) medium or after incubation at 30°C on YPD, YPD containing phleomycin and YPD containing MMS on Days 1, 2 and 3. (E) Growth curve assays were performed in H3D/H3H mutant and WT cells for the indicated time in medium containing different carbon sources. (F) Yeast chromatins extracted from WT (LHT001) and H3D/H3H strains were monitored by western blot analysis with antibodies against H3K4ac, H3K4me2, H3K4me3, H3K18ac, H3K27ac, H3K36me3, H3N (H3 N-terminal), H4ac, H4K16ac and H4. Signals are normalized by anti-H4 antibody. (G) Scatter plot showing the average Reads Per Kilobase per Million mapped reads (RPKM) of two replicates distribution of the WT (LHT001) and H3D/H3H strains. The Pearson's product-moment correlation of Log10(WT_average_RPKM +1) and Log10(H3D/H3H _average_RPKM +1) is 0.9236. The red line is the fitted curve, which has a slope of 0.9966 and which passes through the (0,0) point. R-square is 0.98 and p value≤2.2e-16 (see Materials and methods for details).

Figure 2—figure supplement 1. Mononucleosome preparation from H3D/H3H cells.
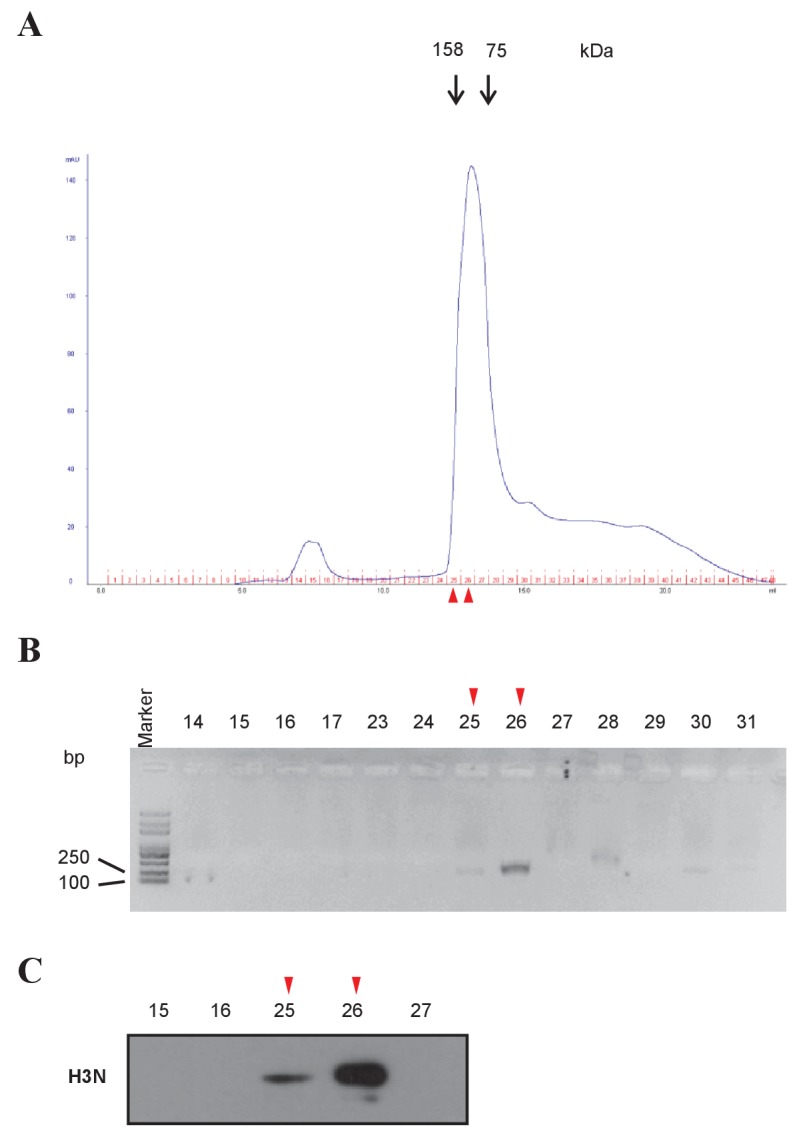
Figure 2—figure supplement 2. Sample-to-sample reproducibility for the RNA-Seq assay of WT (LHT001) and H3D/H3H strains.
