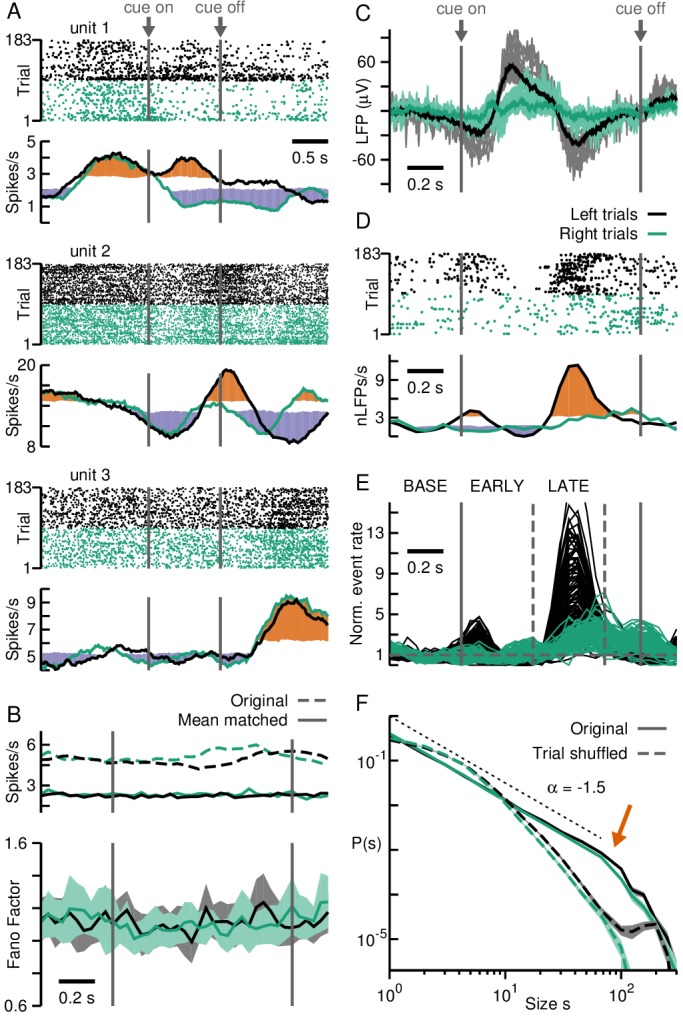
Figure 1. Neuronal avalanches in prefrontal cortex during a cognitive task.

(A) Firing rate changes for putative single units demonstrate PFC region recorded by the array is involved in task performance. Unit raster (top) separated into right (green) and left (black) trials with corresponding average firing rates (bottom). Cue presentation elicits distinct rate changes for units 1 and 2 during left and right trials, but not for unit 3. Colored area (orange/purple) indicates periods that differ significantly (high/low) from baseline (see Materials and methods). Vertical solid lines: Cue on- and off-set. (B) The population of PFC units does not show a task-related change in rate (top) or Fano Factor (bottom). Top: mean-matched/original rate in solid/broken lines; 38/48% survived matching for left/right trials. Bottom: mean-matched spikes. Shaded areas: 95% confidence interval from linear regression per time window. (C) Distinct changes in the LFP for right (green) and left (black) trials during the task. Grey/light green: trial averages for each electrode. Black/dark green: average over electrodes. (D) The negative LFP (nLFP; −2SD threshold; dots) allows for distinguishing right (green) from left (black) trials. Top: Example nLFP raster (single electrode) separated into right (green) and left (black) trials. Bottom: Corresponding time course in average nLFP rate. Colored areas (orange/purple) indicate significant change (high/low) from baseline. (E) Distinct change in nLFP rate separates a baseline (BASE; 400 ms) period from an early (EARLY; 400 ms) and late (LATE; 400 ms) epoch after cue onset (vertical lines). (F) nLFPs on the array when analyzed for full left and right trial periods show avalanche organization. Power law in size probability densities for nLFP clusters (solid; fixed Δt). Arrow: Cut-off at number of electrodes on the array. Broken lines: Corresponding trial-shuffle controls. Shaded areas: Corresponding 95% confidence interval based on bootstrapping. Dotted line: Visual guide for exponent of −1.5.
