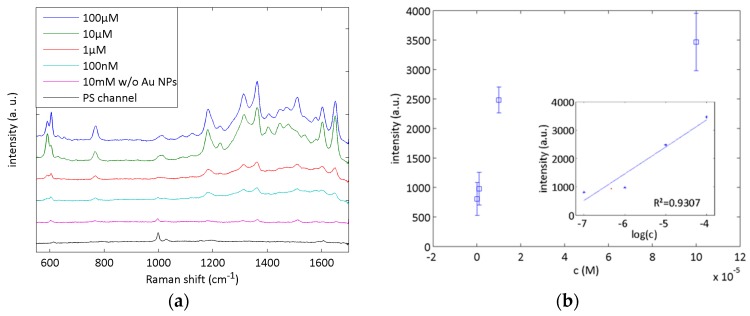
Figure 5.
Microfluidic SERS analysis with Rh6G. Spectra of Rh6G solution at concentrations of 100 nM to 10 mM (a) were recorded with an acquisition time of 10 s and were averaged over 20 randomly chosen spots. The Raman peak at 780 cm−1 was evaluated for quantitative analysis (b), showing a good linear relationship between intensity and logarithmic concentration as shown in the inset.

