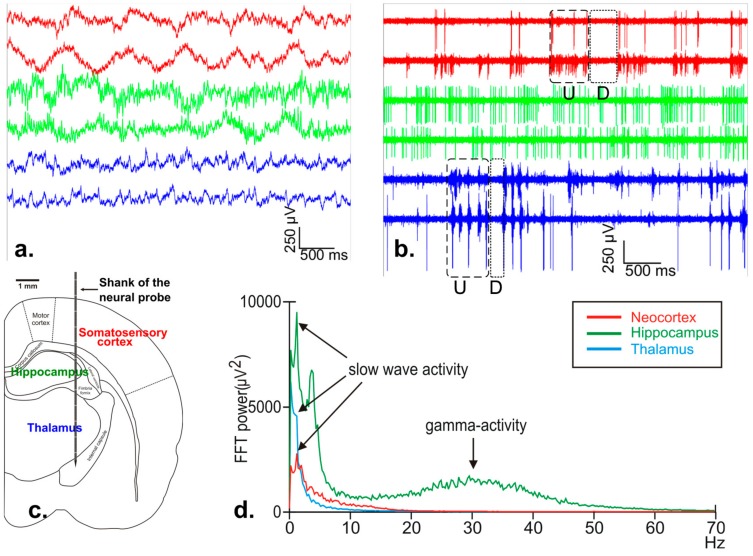
Figure 10.
(a) local field potentials (LFP) simultaneously recorded from the neocortex (red), hippocampus (green), and thalamus (blue). Traces were obtained from the raw data recorded in LFP mode (internal reference, gain 500, low-pass 500 Hz); (b) multi- and single-unit activity recorded simultaneously from the neocortex (red), hippocampus (green), and thalamus (blue). Traces were recorded in action potentials (AP) mode (internal reference, gain 1000, high-pass 500 Hz). Dashed and dotted box indicate neocortical/thalamic up-states (U) and down-states (D); (c) schematic of a coronal rat brain section indicating the estimated position of neural recordings, d. fast Fourier Transform (FFT) plot of the recorded neural activity showing the dominant brain rhythms in the investigated brain areas during ketamine/xylazine anesthesia. Note that slow wave activity (1–1.5 Hz) appeared in all three brain structures, while high gamma activity (30–40 Hz) was present only in the hippocampus.

