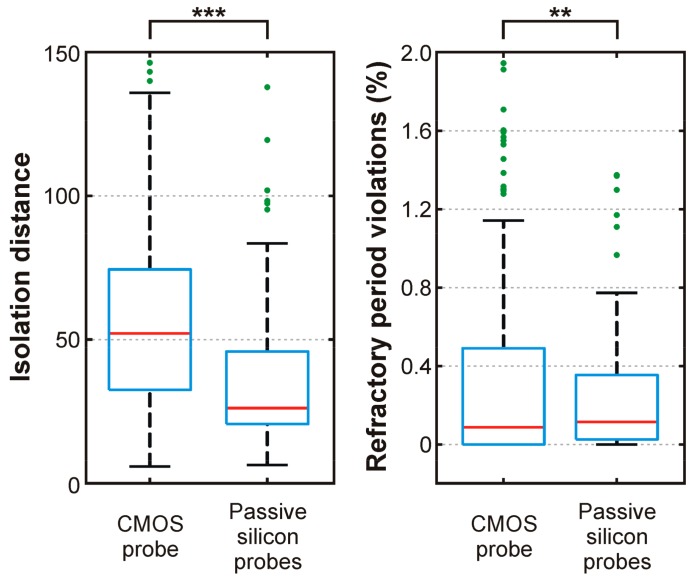
Figure 12.
Cluster quality metrics (isolation distance and refractory period violations) calculated for single units recorded with the CMOS probe (n = 247) and with passive silicon probes (n = 101). Red line: median; blue box: 1st quartile–3rd quartile; whiskers: 1.5× interquartile range above and below the box; green dots: outliers. Extreme outliers are not displayed (isolation distance: 12 data points from the CMOS probe data ranging from 183 to 475; refractory period violations: 22 data points from the CMOS probe data ranging from 2.2 to 13.1 percent and 3 data points from the passive silicon probe data ranging from 2.8 to 4.2 percent). **: p < 0.01; ***: p < 0.001.

