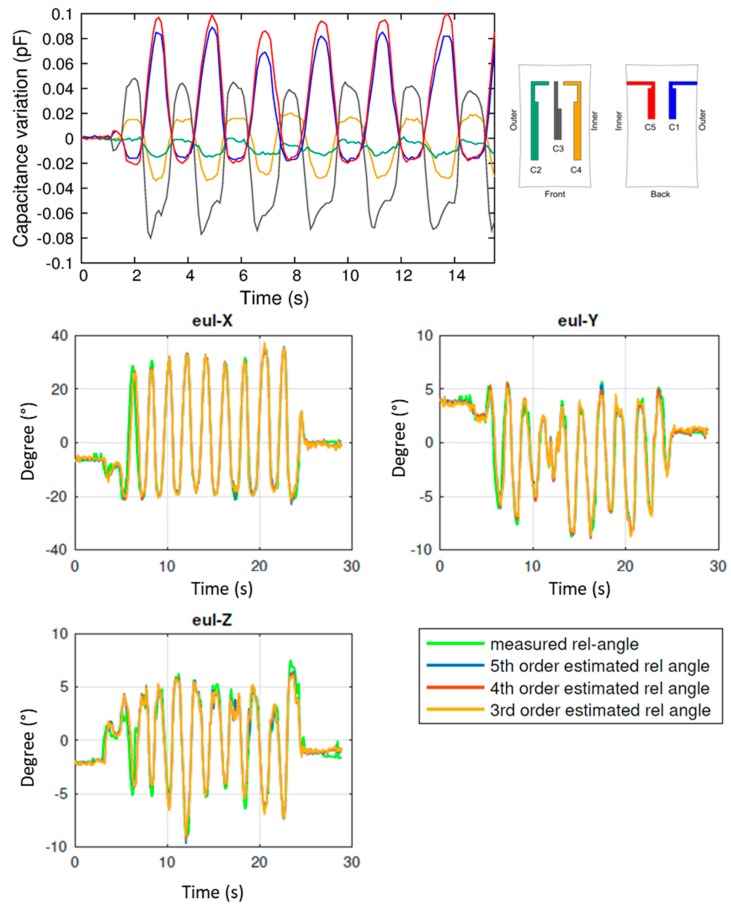
Figure 9.
Results of the experimental analysis performed with the anklet during plantar dorsi/flexion. Top panel: raw capacitance variations of sensors C1 to C5. Bottom panels: reconstruction of the Euler angles (Eul-X, Eul-Y, Eul-Z), and comparison with the values (in green) measured by the optical tracking system.

