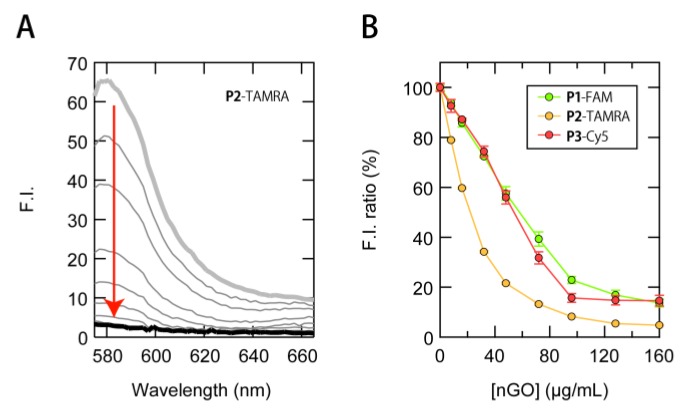
Figure 3.
Preparation of ssDNAs/nGO conjugates. (A) Changes in the emission spectra corresponding predominantly to P2-TAMRA (λex = 535 nm) and (B) the fluorescence ratio of 20 nM fluorophore-modified ssDNAs in the presence of different concentrations of nGO in PBS (pH = 7.4); P1-FAM: λex = 480 nm, λem = 519 nm; P2-TAMRA: λex = 535 nm, λem = 579 nm; P3-Cy5: λex = 630 nm, λem = 664 nm.

