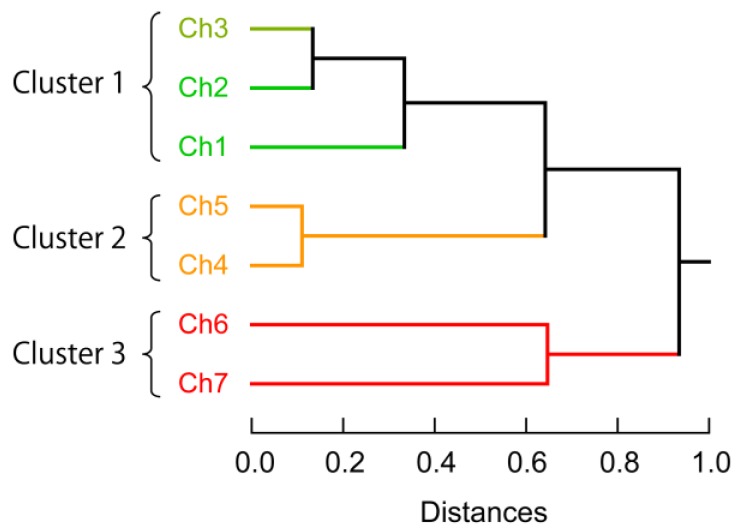
Figure 5.
Clustering analysis of the discriminative channels of the multi-fluorescent ssDNAs/nGO sensor presented in this study. A hierarchical clustering dendrogram was created based on the Euclidean distances using the Ward method and a dataset of 7 channels × 10 analytes × 6 replicates. P1-FAM is primarily excited by Ch1 and Ch2; P2-TAMRA is primarily excited by Ch4 and Ch5; P3-Cy5 is primarily excited by Ch6 and Ch7.

