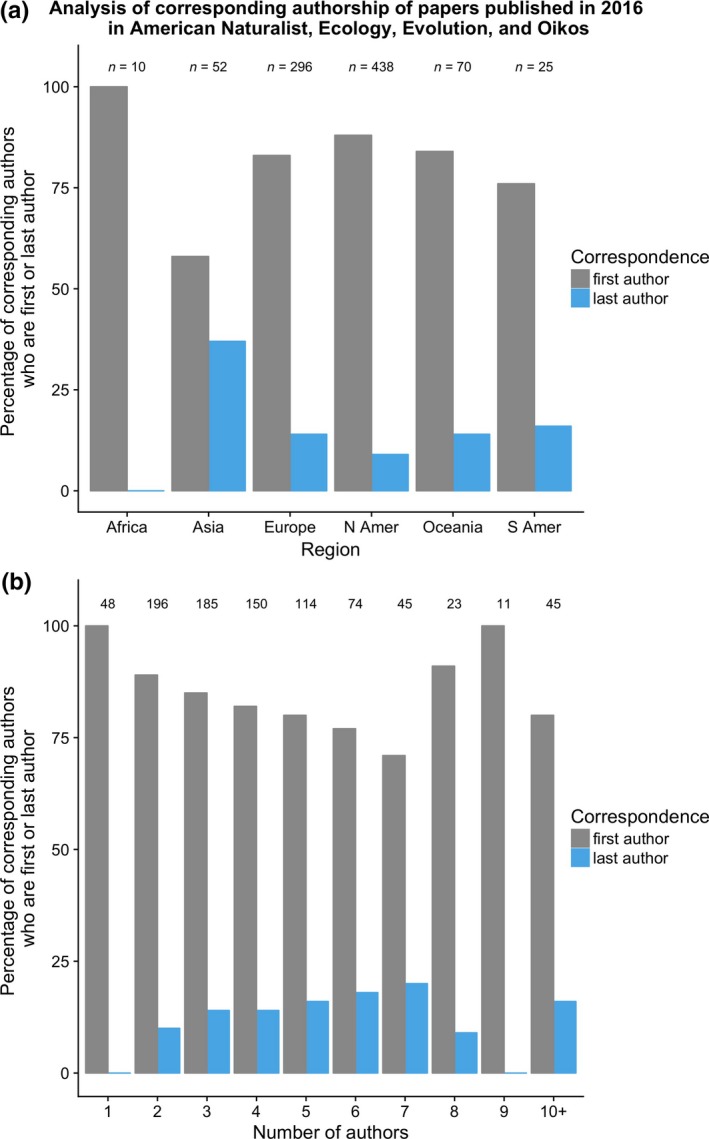
Figure 4.

Influence of geographic region and number of authors on corresponding authorship. (a) Percentage of corresponding authors from different geographic regions who are first author (gray bars) or last author (blue bars). The statistical analysis of this dataset only included regions with at least 50 publications. (b) Relationship between the number of authors on a paper and whether the corresponding author is the first author (gray bars) or last author (blue bars). Numbers over the bars indicate the number of papers in that category. The gray and blue bars do not always sum to 100% because, rarely, the corresponding author was a middle author or a combination of authors (see Fig. 3 for general patterns)
