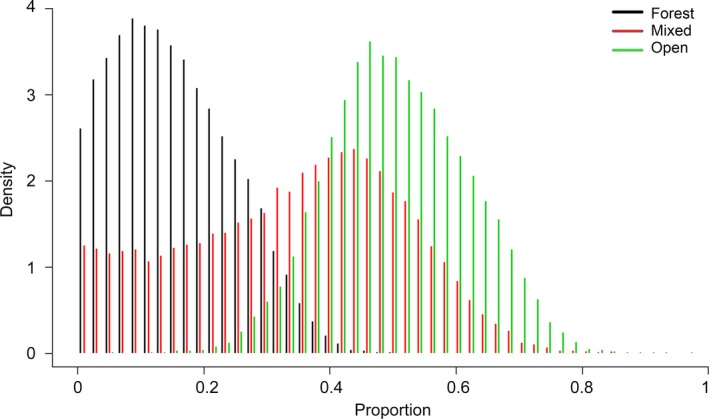
Figure 5.

Relative contribution of dingo diet components according to Bayesian mixing models, where prey were grouped into three categories along a gradient from a primarily C3 diet (forest), to a mix of C3 and C4 (mixed), to a primarily C4 diet (open). Discrimination values were applied to dingo hair to convert to diet values (+4.3‰ and +3.1‰ for δ13C and δ15N, respectively; sensu McLaren et al., 2015), and prey hair to convert to muscle values (+3.2‰ and +2.5‰ for δ13C and δ15N, respectively; sensu Sponheimer, Robinson, Ayliffe, Passey, et al., 2003; Sponheimer, Robinson, Ayliffe, Roeder, et al., 2003)
