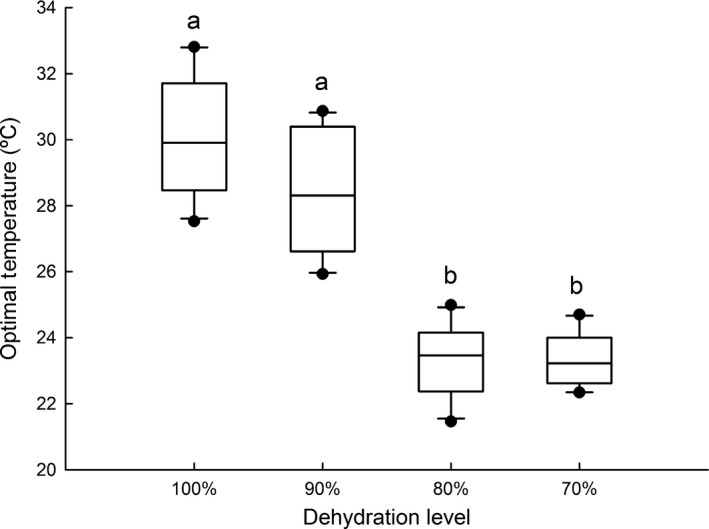
Figure 5.

Optimal temperature for locomotor performance (T o) of Rhinella schneideri at different levels of dehydration. The line inside the box plot, the borders, and the whiskers represent, respectively, the median, the second and third interquartile range, and the range of the data; points are outliers. Different letters above boxplots indicate significant differences
