Figure 2.

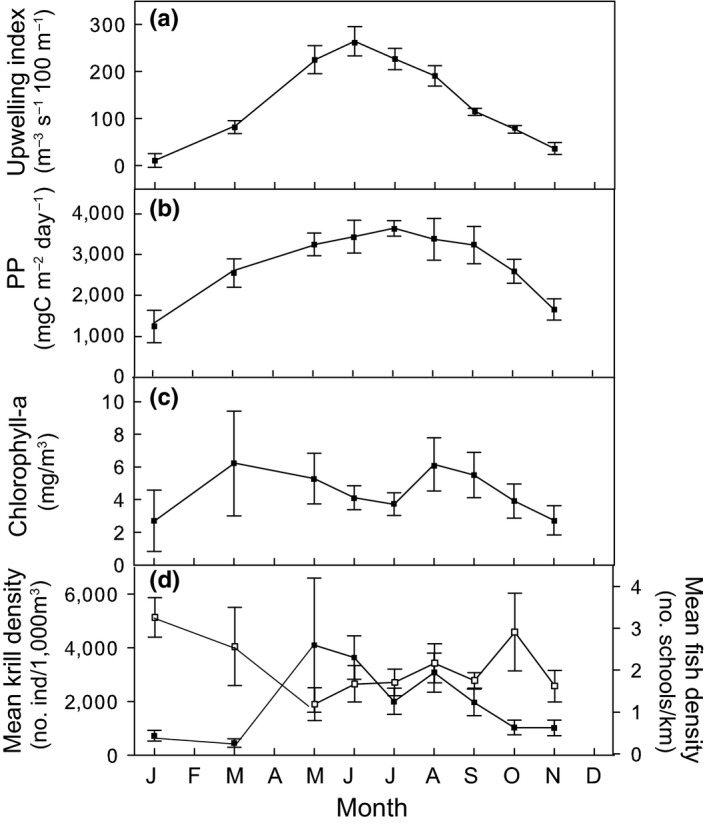
Monthly mean (±1 SE; a) upwelling index, (b) primary production, (c) Chlorophyll a, (d) krill density from 1997 to 2006 (black dots) and forage fish density from 2003 to 2006 (white dots) in Monterey Bay, California

Monthly mean (±1 SE; a) upwelling index, (b) primary production, (c) Chlorophyll a, (d) krill density from 1997 to 2006 (black dots) and forage fish density from 2003 to 2006 (white dots) in Monterey Bay, California