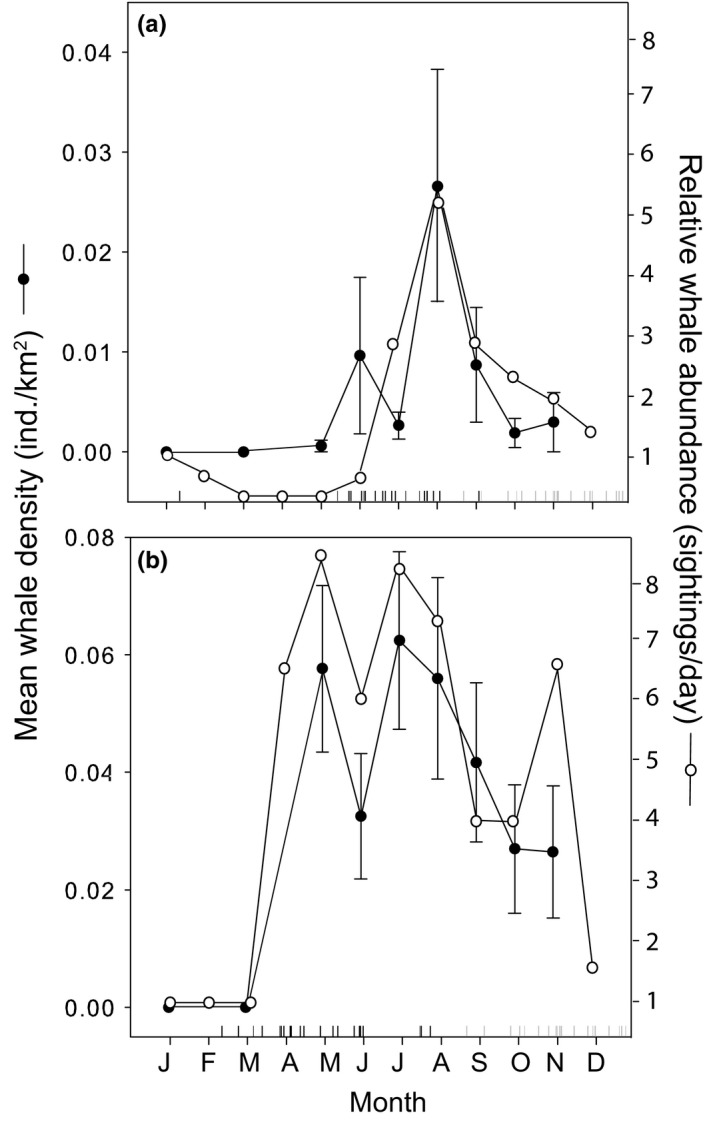
Figure 3.

Monthly mean (±1 SE) whale density from 1997 to 2007 from line‐transect surveys (black dots) and monthly relative whale abundance (calculated as mean number of individual whale sightings per day per species, see Appendix 1 for mean and SE values) from 1993 to 2004 from Whale Watch daily sightings data (white dots) in Monterey Bay, California. (a) Blue whale, (b) humpback whale. In each panel, black and grey vertical marks along the x –axis show the dates of first and last regular sightings of blue (a) and humpback (b) whales in Monterey Bay each year from 1993 to 2004.
