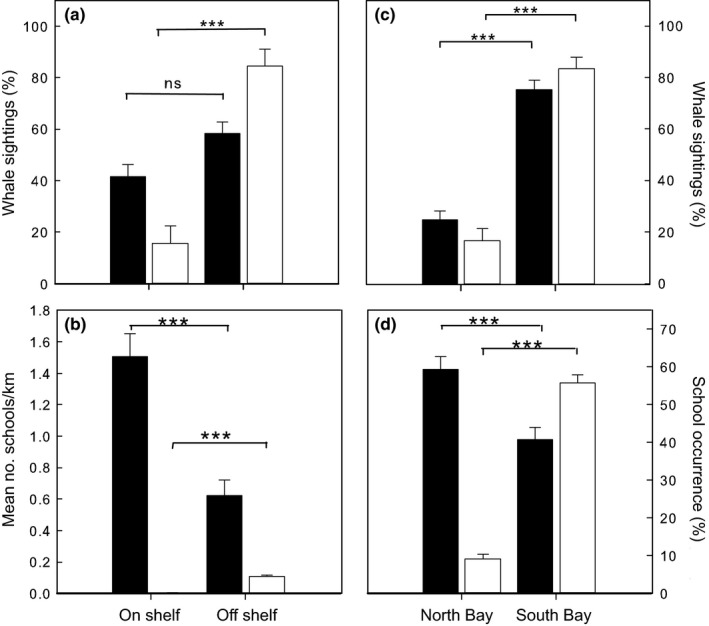
Figure 4.

Spatial distribution of whales, krill and fish schools in Monterey Bay California. (a) Mean percentage (±1 SE) of humpback (black bars) and blue (white bars) whale sightings on and off the continental shelf in Monterey Bay. (b) Mean density (±1 SE) of fish (black bars) and krill (white bars) schools on and off the continental shelf in Monterey Bay. (c) Mean percentage (±1 SE) of humpback (black bars) and blue (white bars) whale sightings in north (>36.81°N) and south (<36.81°N) Monterey Bay. (d) Mean percentage (±1 SE) of fish (black bars) and krill (white bars) schools in north (>36.81°N) and south (<36.81°N) Monterey Bay. ns: not significant, ***p < .01, Mann–Whitney Test
