
Figure 5.
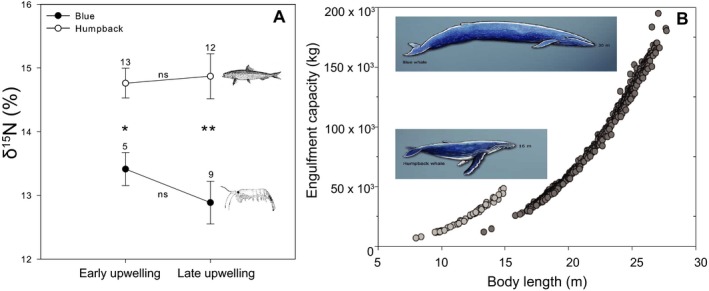
Humpback and blue whale inferred diet and engulfment capacity. (a) Mean isotope values (±1 SE) for humpback whales (white circles) and blue whales (black circles) before and after 15th July 2015 (transition between early and late upwelling periods) in Monterey Bay, California. ns: not significant, *p < .05, **p < .01, Mann–Whitney Test. Lower δ15N values may represent a diet dominated by krill, higher δ15N values may represent a diet dominated by forage fish. (b) Relationship between engulfment capacity and body length in the humpback whale (white dots) and blue whale (grey dots) based on a mechanistic model from Goldbogen et al. (2011).