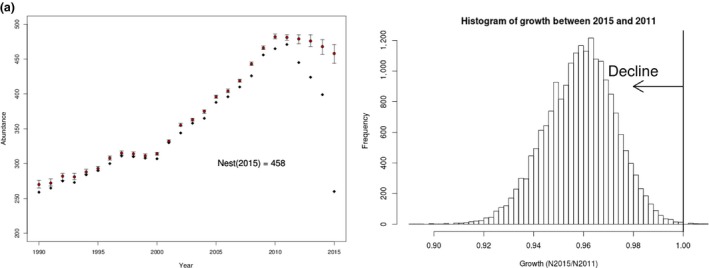
Figure 2.

Abundance of North Atlantic right whales 1990–2015 as estimated from mark–resight data as calculated from two procedures. Black diamonds are counts of the minimum number of individuals seen alive (MNA) that year plus those seen before and after that year. Circles with error bars are posterior medians and associated 95% credible intervals from a Bayesian mark–recapture model allowing random fluctuation among years, age effects and adult female effects on survival, as well as sex and time effects and random effects of individual catchability on capture probabilities together with their 95% critical regions. Inset shows the posterior distribution of estimated growth of the North Atlantic right whale population between 2015 and 2010 measured as a ratio (N2015/N2010) of abundance estimates from Bayesian implementation of J‐S model. Almost all (99.99%) of the estimates of growth are below 1.0, indicating a population decline
