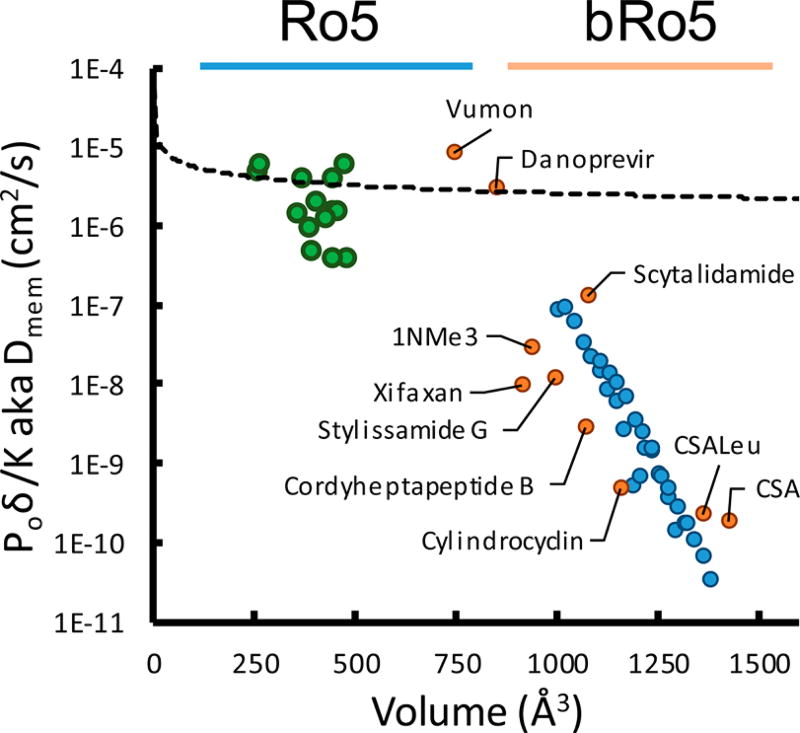
Figure 5.
Membrane diffusion vs molecular volume. Diffusion was determined by eq 4 using experimental values of P0 and Khc/w. The volume was calculated from a 2D structure using a parametrized method. Small Ro5 molecules (green points) roughly follow an exponential trend, whereas the bRo5 lipophilicity scanning library members (Figure 2) (blue points) are subject to a much steeper size penalty. A selection of unrelated synthetic and natural products was subjected to the same analysis to ensure the trends are general (orange points).

