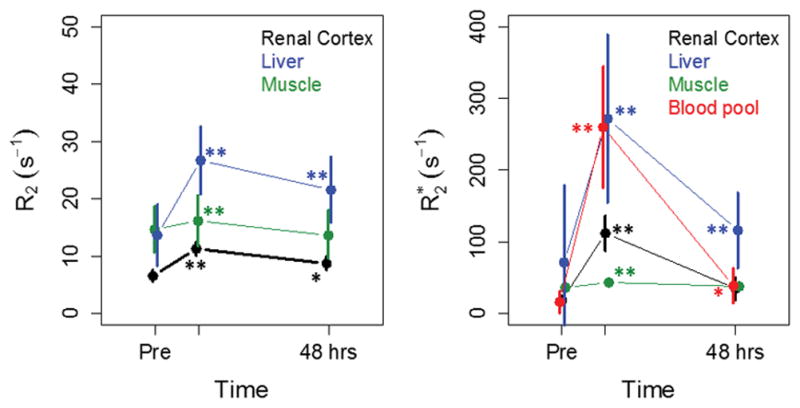
Figure 2.

Mean (±SD) of R2 (a) and R2* (b) in normal tissues as a function of time for all patients. Significant changes in R2 and R2* compared to pre- values are indicated by ** (p<0.005) and * (p<0.05), assessed by paired t-test. Similar patterns of change were seen on Day 15 scans.
