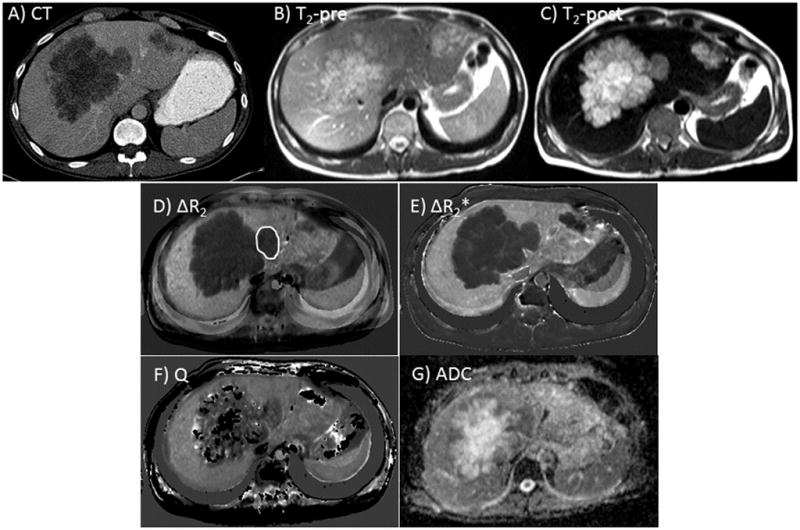
Figure 3.

Diagnostic CT (a), pre- (b) and post-ferumoxytol (c) T2-weighted MRI scans from a representative patient with several large, partially necrotic liver metastases from colorectal cancer. ΔR2 and ΔR2* maps (d, e) and Q and ADC maps (f, g) are also shown. The target lesion for ROI measurements is highlighted in (d).
