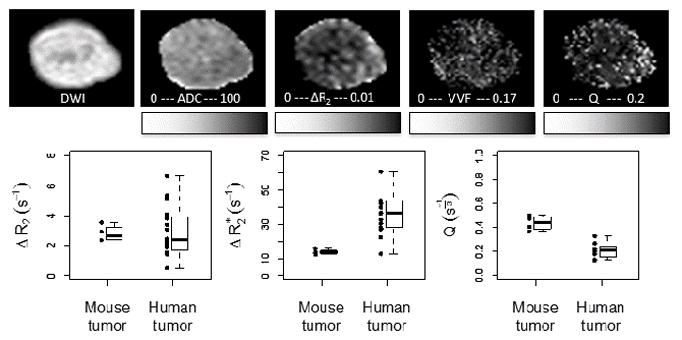
Figure 9.

Representative diffusion-weighted image and maps of ADC, ΔR2, ΔR2*, and Q of an HM-7 xenograft tumor grown on the hindlimb of an athymic nude mouse. Range of ΔR2, ΔR2* and Q (a, b, c) measured in HM-7 xenograft tumors in mice as well as all evaluated tumors in humans. Points represent individual results, while boxplots summarize the group data.
