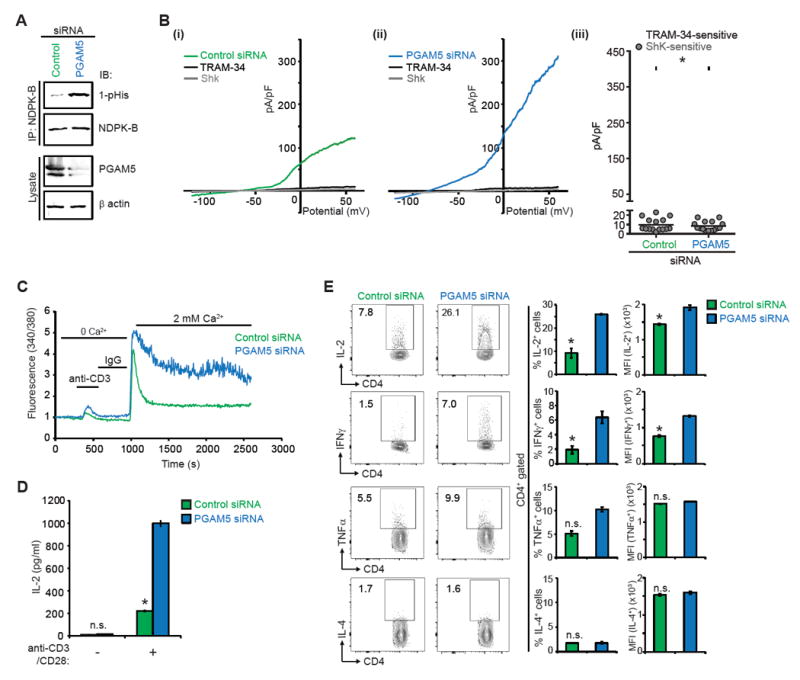
Figure 4. PGAM5 controls activation of primary human CD4+ T cells.

(A-E) Primary human naïve CD4+ T cells were transfected with PGAM5 or control siRNA, rested overnight, and then activated with anti-CD3 and anti-CD28 antibodies for 48h to generate Th0 CD4+ T cells, unless otherwise stated.
(A) Lysates were IP with anti-NDPK-B and NDPK-B phosphorylation was assessed by IB with anti-1-pHis antibodies. Lysates were also probed with anti-PGAM5 and anti-β actin antibodies to check for PGAM5 knockdown.
(B) Whole cell patch clamp was performed on cells to determine KCa3.1 and Kv1.3 activity. Shown are I/V plots of the cells transfected with: (i) control or (ii) PGAM5 siRNA. (iii) Scatter plot of TRAM-34-sensitive current plotted at +60 mV (n = 15 to 20 cells each). TRAM-34 and ShK are specific inhibitors of KCa3.1 and Kv1.3 channel activity, respectively(Srivastava et al., 2006a).
(C) Th0 cells were rested overnight, re-stimulated with anti-CD3, loaded with Fura-2 AM (5 μM) and attached to a poly-L-lysine-coated coverslip for 20 min. Ca2+ imaging was done with an IX81 epifluorescence microscope (Olympus) and data were analyzed using OpenLab imaging software (Improvision) (n= 80–100 cells for each series), as previously described (Srivastava et al., 2009).
(D) Quantification of soluble IL-2 secreted by Th0 cells rested overnight and re-stimulated with anti-CD3/CD28 antibodies for 6h.
(E) Representative intracellular flow cytometry detecting cytokine expression in cells that were rested overnight and re-stimulated with PMA/ionomycin for 4h (left panel). Shown are %positive (middle panel) and mean fluorescence intensity (MFI) (right panel) of cytokine producing cells.
Data are representative of three independent experiments. Data are shown as mean±SEM. Statistical significance was calculated using Student’s t test; *(p<0.05); **(p<0.01); not significant (n.s.) (p>0.05).
See also Figure S4.
