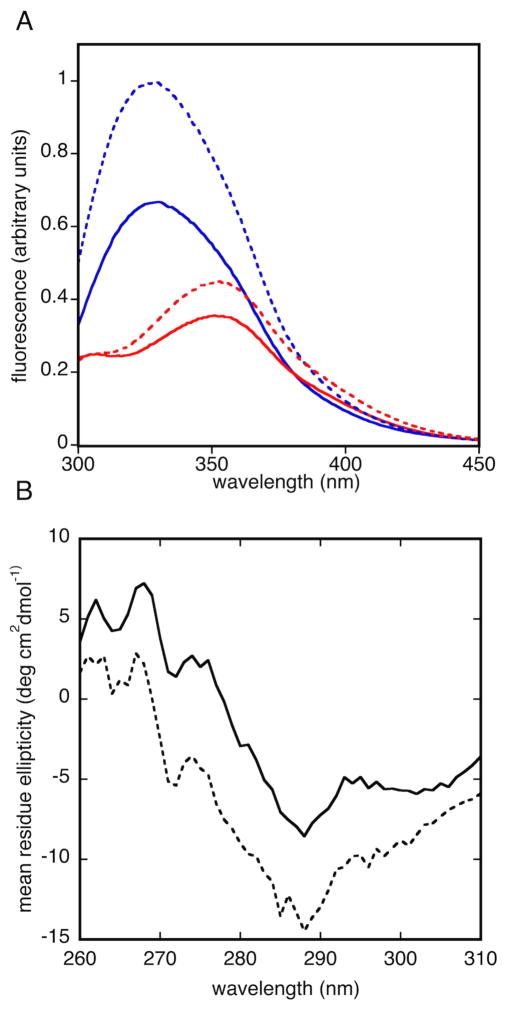
Figure 5. Tryptophan fluorescence and near ultraviolet circular dichroism of Bsc4.
(A) Tryptophan fluorescence emission spectrum of Bsc4 S288C (S288C, solid line; EC1118, dashed line) at 50 μM in 50 mM MES (pH 5.5), 100 mM KCl, 1 mM TCEP with (red) or without (blue) 6 M guanidine; (B) Near ultraviolet circular dichroism spectra of Bsc4 oligomers (S288C reduced, solid line; EC1118, dashed line) from 310–260 nm at 20 °C, at 100 μM protein concentration in a 1 cm pathlength cell, in 50 mM MES (pH 5.5), 100 mM KCl, 1 mM TCEP. The tryptophan fluorescence spectra show a maximum near 328 nm for folded Bsc4 and 351 nm for guanidine denatured Bsc4.

