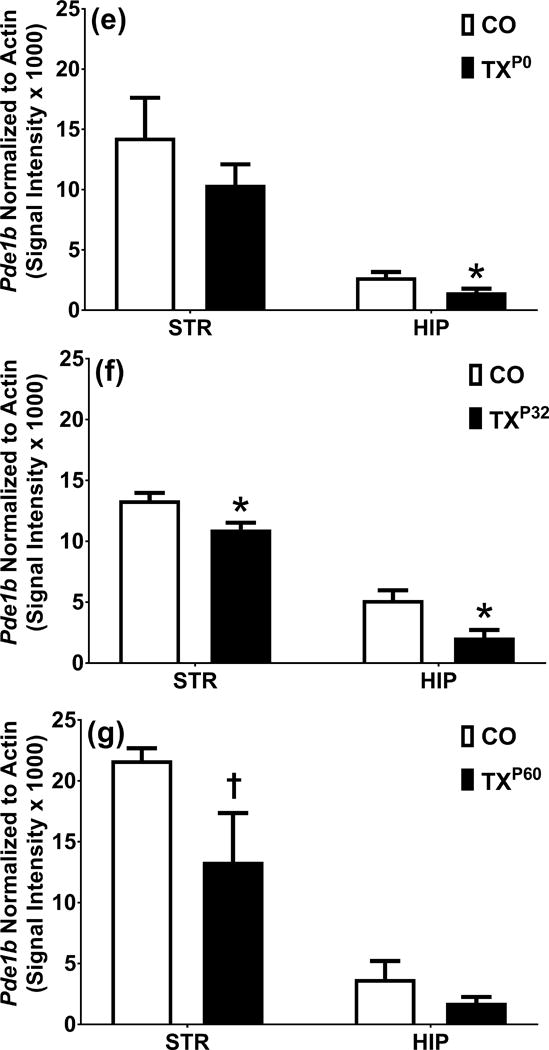
Figure 6.

Analysis of localization and quantity of PDE1B in KOP0, P32, P60 mice. a. Expression pattern of CaMKIIα Cre driver and PDE1B in striatum of P0 corn oil dosed mice. a′. Expression pattern of CaMKIIα Cre driver and PDE1B in striatum of P0 tamoxifen dosed mice. b. DAPI corn oil. b’. DAPI tamoxifen. c. PDE1B corn oil. c’. PDE1B tamoxifen. d. ROSA corn oil. d’. ROSA tamoxifen. e. Western blot analysis of striatum and hippocampus in P0 dosed mice. f. Western blot analysis of striatum and hippocampus in P32 dosed mice. g. Western blot analysis of striatum and hippocampus in P60 dosed mice. Blue = DAPI, Green = PDE1B, Red = Td-Tomato. 2000 μm. †p < 0.1 and *p < 0.05.
