
Figure 2. RMFG Cortical Thickness Among Siblings Discordant for Perceived Stress.
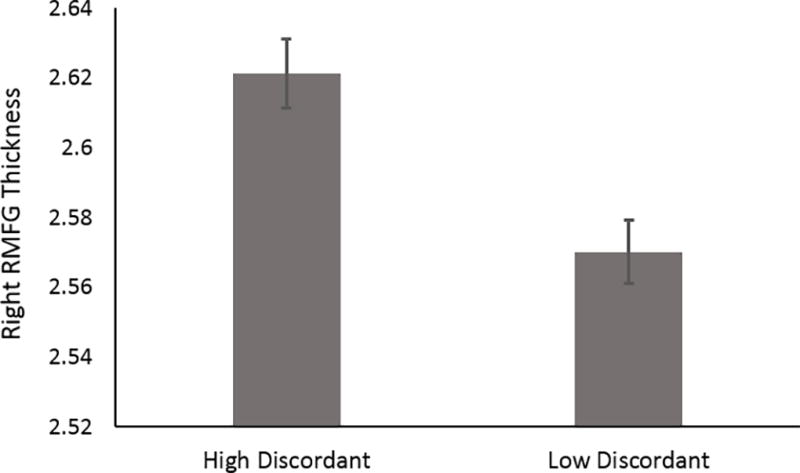
Among sibling pairs discordant for perceived stress, those who reported relatively high levels (≥ 0.5 standard deviation units above the mean) had thicker right RMFG relative to those reporting relatively low levels (≤ 0.5 standard deviation units below the mean; p=4×10⁻⁷). Error bars depict standard error of the mean.