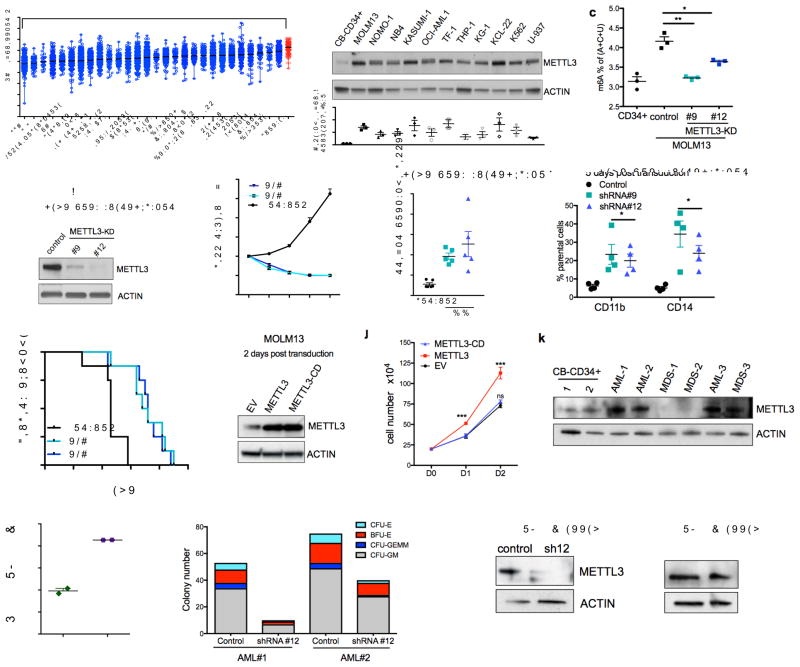
Figure 2. m6A promotes leukemogenesis.
(a) METTL3 mRNA expression in acute myeloid leukemia (AML) compared to other cancers (The Cancer Genome Atlas database). Data are presented as mean log2 expression with range. AML: orange dots, **** p<0.00001, ** p<0.01 ANOVA with multiple comparisons,
(b) METTL3 protein expression in AML cell lines compared to normal HSPCs. Top: An immunoblot for METTL3 and loading control (ACTIN) in the indicated myeloid leukemia cell lines and cord blood (CB) CD34+ cells. Bottom: quantitative summary of the immunoblots. n=3 independent experiments; error bars, s.e.m. * p<0.05, **p<0.01,***p<0.001 two-tailed t test.
(c) Global m6A levels in AML cells versus normal HSPCs. m6A levels from poly(A) purified mRNA were quantified in CB-CD34+ and MOLM-13 AML cells by two-dimensional thin layer chromatography (2D-TLC, see methods). n=3 independent experiments, two-tailed t test.
(d–h) MOLM13 cells were transduced with lentiviruses expressing either a scramble (control) shRNA or two independent shRNAs targeting METTL3 (#9 and #12; METTL3-KD). Cells were selected for puromycin resistance and assayed four days post transduction.
(d) Representative immunoblot for METTL3 depletion four days post-transduction.
(e) Proliferation assay of MOLM13 control cells versus METTL3 knockdown. The number of viable cells was measured daily beginning four days post-transduction of shRNAs: shRNA#9 and #12 (light blue and dark blue lines) and control shRNA (black line).
(f) The percent of apoptotic cells was determined five days post-transduction by flow cytometry analysis for Annexin V positivity.n=5, independent experiments; error bars, s.e.m. * p<0.05, **p<0.01 two-tailed t test.
(g) Cells were stained for myeloid differentiation markers CD11b and CD14 five days post-transduction. Quantification of positive cells was performed by flow cytometry. METTL3 knockdown cells (light and dark blue bars) versus control cells (black bars). n = 4 independent experiments; error bars, s.e.m. * p<0.05, **p<0.01 two-tailed t test.
(h) Leukemia-free survival of mice transplanted with MOLM13 cells transduced with either a control shRNA or METTL3-targeting shRNAs. MOLM13 cells at four days post transduction were injected into sub-lethally irradiated mice (n=8 for each group). Mantel-Cox test ****p<0.0001.
(i–j) MOLM13 cells were retrovirally transduced with vectors expressing METTL3 and METTL3-CD. Cells were sorted two days post-transduction based on GFP positivity.
(i) Representative immunoblot analysis of METTL3 expression. ACTIN serves as loading control.
(j) Proliferation assay of MOLM13 cells transduced with empty vector (EV), METTL3, or METTL3-CD overexpressing vectors. The number of viable cells was measured daily beginning two days post-transduction. n = 3 independent experiments; error bars, s.e.m. ***p<0.001 two-tailed t test.
(k) Immunoblot analysis of METTL3 protein expression in primary MDS and AML patient cells. ACTIN serves as loading control. Quantitative summary is shown.
(l) Global m6A levels in primary AML patient cells versus normal HSPCs.
(m) Colony forming ability of primary AML patient cells depleted of METTL3. Primary AML patient cells were transduced with control and shRNA targeting METTL3. Cells were sorted based on GFP positivity after 3 days. Cells were plated in methycellulose and colonies were scored after 14 days.
(n) Immunoblot showing METTL3 expression before (D0) and 14 days after (D14) plating of primary AML patient cells in (m). ACTIN serves as loading control. Quantitative summary is shown.

