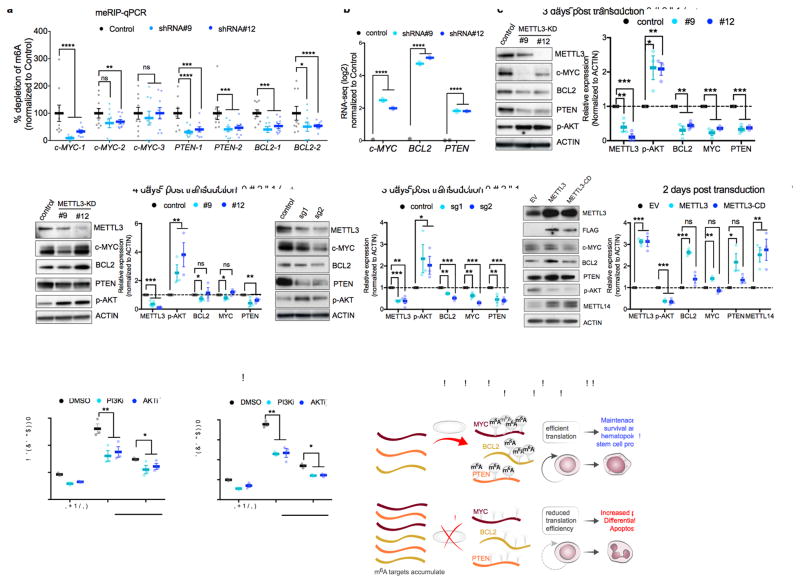
Figure 4. m6A directly controls expression of c-MYC, BCL-2 and PTEN.
(a) m6A enrichment at transcripts of c-MYC, BCL-2 and PTEN. Poly(A)+ RNA was isolated from control and METTL3 knockdown MOLM13 cells. In vitro transcribed A and m6A-containing mRNA was then immunoprecipitated with an anti-m6A antibody. Enrichment of m6A at multiple sites (boxes highlighted in Supplementary figure 5a) at transcripts of c-MYC, BCL-2 and PTEN was determined by qPCR.
(b) MYC, BCL2, and PTEN mRNA expression in MOLM13 METTL3 knockdown cells. Plotted is the average change in expression from RNA-Seq of METTL3 knockdown (light and dark blue) compared to control knockdown cells (black) from Figure 3b.
(c–d) Immunoblot analysis for proteins that were associated with the m6A program, e.g., c-MYC, BCL2 and PTEN (based on global genomic approaches or RPPA in Figure 3d–h) The panels are representative blots from three days (c) or four days (d) post-transduction of MOLM13 cells with shRNAs targeting METTL3. ACTIN serves as loading control. Top: representative immunoblot images. Bottom: quantitative summary of the immunoblots. n=3 for 3 days, n=6 for METTL3 expression and n=3 for target genes expression for 4 days independent experiments; error bars, s.e.m. * p<0.05, **p<0.01,***p<0.001 two-tailed t test.
(e) Immunoblot analysis for proteins that were associated with the m6A program three days post transduction of MOLM13 cells with sgRNAs targeting METTL3. ACTIN serves as loading control. Top: representative immunoblot images. Bottom: quantitative summary of the immunoblots. n=4 independent experiments; error bars, s.e.m. * p<0.05, **p<0.01,***p<0.001 two-tailed t test
(f) Immunoblot analysis for proteins that were associated with the m6A program two days post transduction of MOLM13 cells overexpressing wild type METTL3 or METTL3 catalytically dead (METTL3-CD). ACTIN serves as loading control. Top: representative immunoblot images. Bottom: quantitative summary of the immunoblots. n=3 independent experiments; error bars, s.e.m. * p<0.05, **p<0.01,***p<0.001 two-tailed t test
(g–h) Inhibition of the AKT pathway inhibits myeloid differentiation of MOLM13 METTL3 knockdown cells. MOLM13 cells were transduced with shRNAs for three days followed by treatment with DMSO (gray bars), GDC-0068 AKT inhibitor (1 μM, purple bars), or GDC-0032 PI3K inhibitor (0.1 μM, pink bars) for 48 h before myeloid differentiation. Differentiation was assessed by flow cytometry as previously described (Fig. 1m) (n=3 independent experiments; error bars, s.e.m. * p<0.05, **p<0.001, *** p <0.0001 two-tailed t test.
(i) A proposed model of METTL3-dependent myeloid differentiation. METTL3 upregulation in AML cells results in methylation of specific mRNAs critical for regulating apoptosis and differentiation, including MYC, BCL2, and PTEN. Methylated targets are efficiently translated resulting in survival, proliferation, and maintenance of the hematopoietic stem cell program (top panel). Depletion of METTL3 in AML cells reduces translation associated with m6A transcripts resulting in AKT activation, differentiation, and apoptosis.

