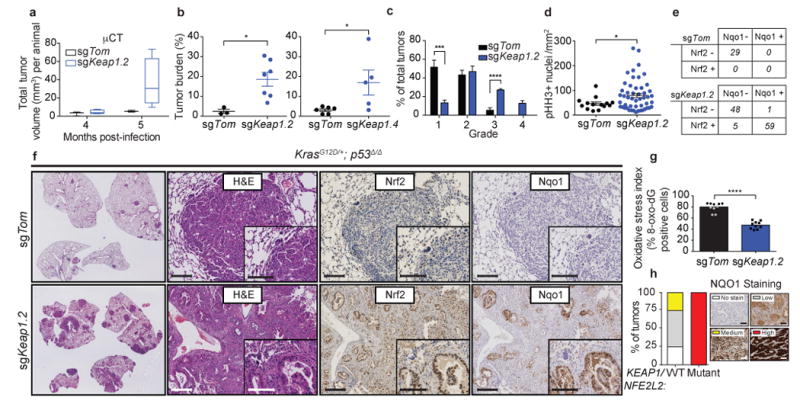
Figure 1. Loss of Keap1 stabilizes Nrf2 and accelerates lung tumorigenesis.

a) Micro-computed tomography (micro-CT) quantification of total tumor volume (mm3) of tumors from sgKeap1.4 (n = 5) or sgTom (n = 3) infected animals at 4 and 5 months post infection. b) Combined quantification of tumor burden (total tumor area/total lung area) in KrasLSL-G12D/+; p53fl/fl (KP) animals after infection with pSECC lentiviruses. Left panel: tumor burden 21 weeks post infection of animals infected with control sgTom (n = 3) or sgKeap1.2 (n = 7). Right panel: tumor burden 21 weeks post infection of animals infected with control sgTom (n = 6) or sgKeap1.4 (n = 5). The asterisks indicate statistical significance obtained from comparing KP-sgKeap1 samples to KP-sgTom samples. c) Distribution of histological tumor grades in KP animals 21 weeks after infection with pSECC lentiviruses expressing: control (sgTom, KP; n = 7 mice), sgKeap1.2 (KP; n = 3 mice). d) Quantification of phospho-Histone H3 (pHH3) positive nuclei per mm2 to assess the mitotic index of tumor cells from lung tumors in KP animals 21 weeks after infection with pSECC lentiviruses expressing: control (sgTom, n = 14 tumors), or sgKeap1.2 (n = 50 tumors). e) Contingency tables demonstrating correlation between nuclear Nrf2 expression and Nqo1 expression. Top panel: quantified tumors obtained from control sgTom infected mice. Bottom panel: quantified tumors obtained from sgKeap1.2 infected mice (two-sided Fisher's exact test, ****p < 0.0001). f) Representative hematoxylin and eosin (H&E) and immunohistochemistry (IHC) staining of serial sections from lung tumors of mice 21 weeks after infection with pSECC-sgTom (top panel) or pSECC-sgKeap1.2 (bottom panel). First panels: representative overall lung tumor burden. Second panel: higher magnification H&E of representative tumors. Third panel: Nuclear Nrf2 IHC. Fourth panel: Nqo1 IHC. Note the accumulation of Nrf2 and Nqo1 occurs only in tumors from pSECC-sgKeap1.2 mice. Inset represents higher magnification. Scale bars are 100um. g) Oxidative stress index as judged by % 8-oxo-dG positive nuclei (n = 10 per genotype). All error bars denote s.e.m. Obtained from two-sided Student's t-test unless otherwise noted. *p < 0.05, ***p < 0.001, ****p < 0.0001. h) KEAP1/NRF2-mutant versus WT human LUAD biopsy IHC for NQO1. All tumor samples were confirmed to be KEAP1/NRF2 mutant via targeted exome sequencing (See Supplementary Table 1). Right legend depicts examples of staining criteria.
