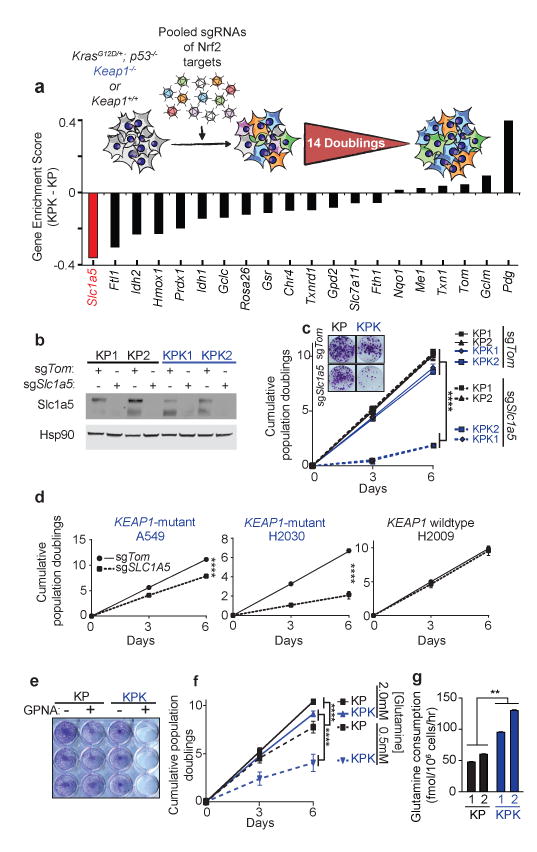
Figure 3. CRISPR screen reveals that Keap1-mutant cells are glycolytic and sensitive to reduced levels of glutamine.

a) Pooled sgRNA library screen. Figure inlet; schematic of experiment. Cells were passaged for 14 doublings before collection. Bars represent the median differential genescore. Full representation in Supplementary Fig 7a. b) Western blot analysis of Slc1a5 in KP and KPK cells post selection infected with sgTom or sgSlc1a5. Hsp90 was used as a loading control. c) Cumulative population doublings of KP and KPK cells after transduction with sgTom or sgSlc1a5 (n = 4). Picture inlet; colony formation assay in KP and KPK cells transduced with sgTom or sgSlc1a5. ****p < 0.0001 obtained from 2-way ANOVA. d) Cumulative population doublings of KRAS-mutant human lung cancer cell line either KEAP1-WT (H2009) or KEAP1-mutant (A549 and H2030) after selection with sgTom or sgSLC1A5 (n = 4). ****p < 0.0001 obtained from 2-way ANOVA. e) Crystal violet stain of KP and KPK cells treated with 1mM GPNA or Vehicle for 72 hrs. f) Cumulative population doublings of KP and KPK cells cultured in 2.0mM or 0.5mM glutamine (n = 4). ****p < 0.0001 obtained from 2-way ANOVA. g) Glutamine consumption in KP and KPK cells measured (n = 3). All samples were normalized to their respective vehicle treated control. **p < 0.01 obtained from 1-way ANOVA with Tukey's post hoc test. All error bars depict s.e.m.
