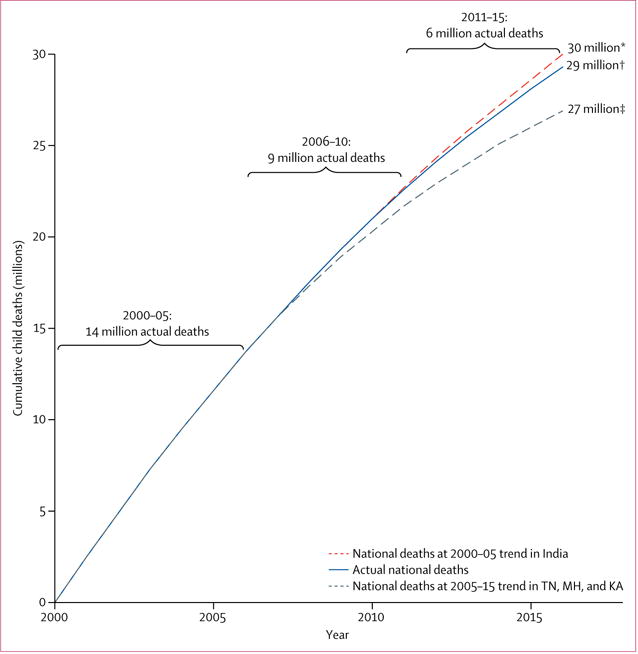
Figure 5. Child deaths for all causes since 2000 in India.

We calculated cumulative numbers of deaths for each scenario for 2000–15. 2000–05 covers 6 years, whereas 2006–10 and 2011–15 cover 5 years each. KA=Karnataka. MH=Maharashtra. TN=Tamil Nadu. *Estimated cumulative number of deaths had all of India followed its 2000–05 trend. †Estimated cumulative number of deaths by 2015. ‡Estimated cumulative number of deaths had all of India followed the average 2005–15 trend in KA, MH, and TN.
