
Figure 4.
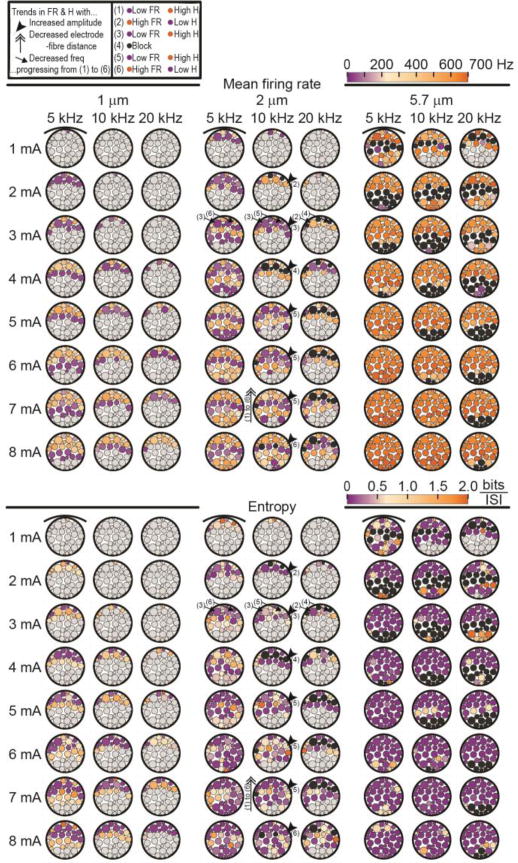
Mean firing rates (top section) and entropy (bottom section) without intrinsic activity. Both output measures use the same colour bar to illustrate that lower mean firing rate (purpletop section) is generally associated with higher entropy (orangebottom section)and vice versa (see also Figure 5). The upper-left legend defines the arrows and numerical labels illustrating the trends in mean firing rate (FR) and entropy (H) from (1) to (6) as the KHF stimulation amplitude is increasedthe electrode-fibre distance is decreasedor the frequency is decreased. The arrows on the entropy plots are taken from identification of the banding patterns in the mean firing rate data to show that a similar trend exists. Black fascicles indicate block and light grey fascicles indicate transmission.