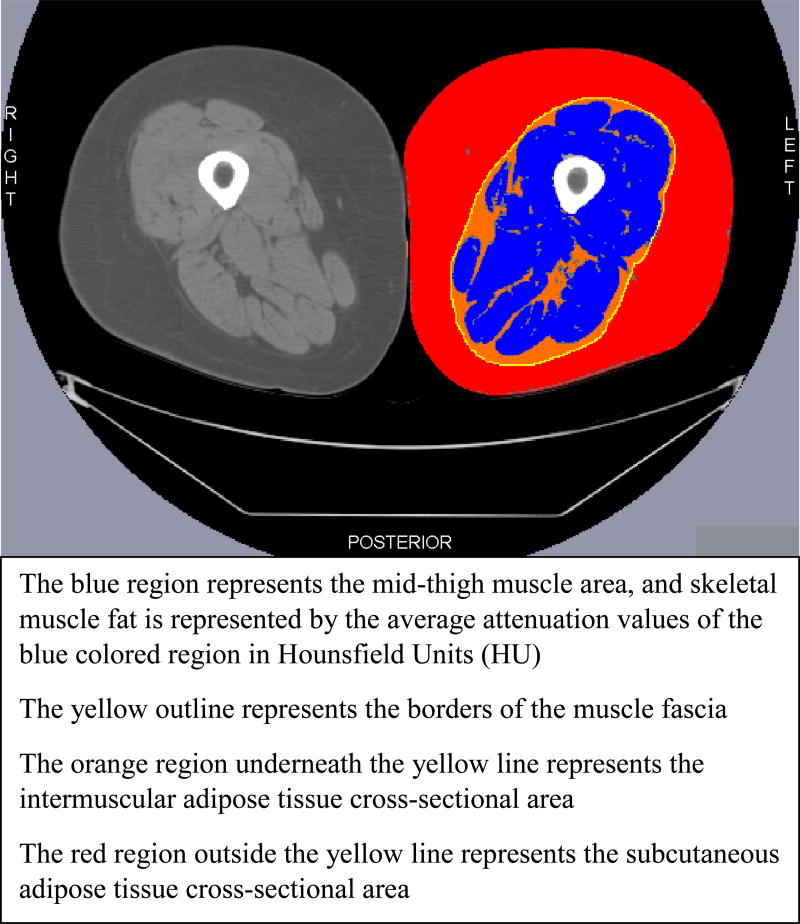
Figure 1.
Cross-sectional Bilateral Images of the Mid-thigh Region Illustrating Skeletal Muscle Fat, Intermuscular Adipose Tissue and Subcutaneous Adipose Tissue. The right mid-thigh cross-section shows the original image obtained by Computed Tomography, and the left mid-thigh cross-section represents the processed image with the fat depots.

