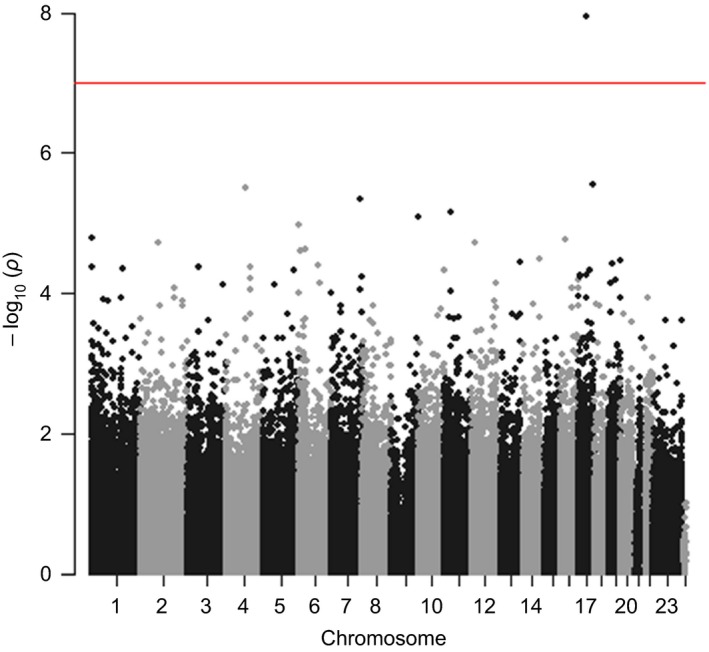
Figure 1.

Manhattan plot of methylome‐wide DNA methylation associations (birth and age 7) with amygdala:hippocampus volume ratio (age 18–21), controlling for intracranial volume. Red line indicates methylome‐wide threshold at p < 1 × 10⁻⁷ [Colour figure can be viewed at wileyonlinelibrary.com]
