
Figure 1.
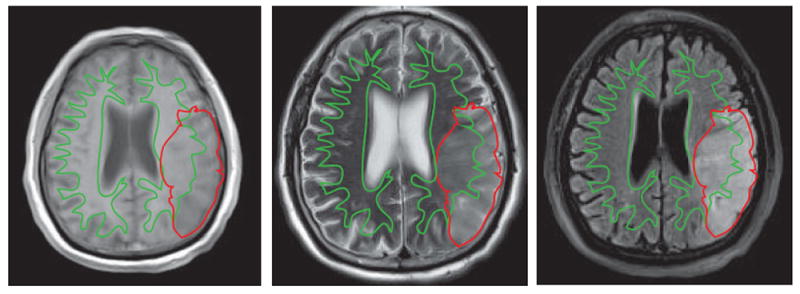
Transverse images in a 73-year-old man 48 hours after left middle cerebral artery (MCA) occlusion. T1 WI (a) shows mixed areas of abnormal signal intensity in the GM and WM of the temporal lobe. T2 WI (b) and FLAIR (c) images demonstrate high intensity signal in the infarct zone with subtle prominence of WM. WM is traced with a green line and the infarct region is traced with a red line. WM infarct regions are enclosed by both the red and green outlines, whereas GM infarct regions are defined as red regions outside the green outline.