
Figure 3.
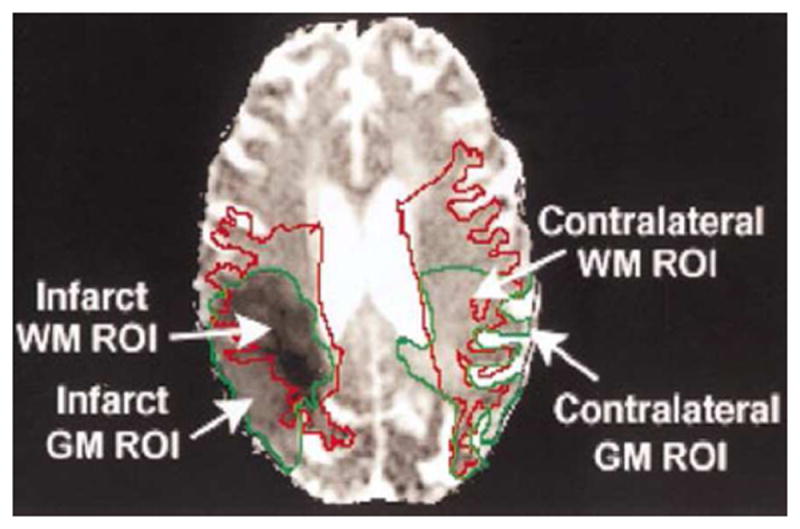
DTI image in an 87-year-old woman 3–4 days after middle cerebral artery occlusion. The region of interest (ROI) in WM was traced as a red line in both ipsilateral and contralateral hemispheres. The infarct regions were outlined with green lines. Infarct WM is enclosed by both the red and green outlines. The regions enclosed by the green outline but outside the red outline are infarct GM (adapted from Radiology 2000, 215:211-220 with permission).