Fig. 2.

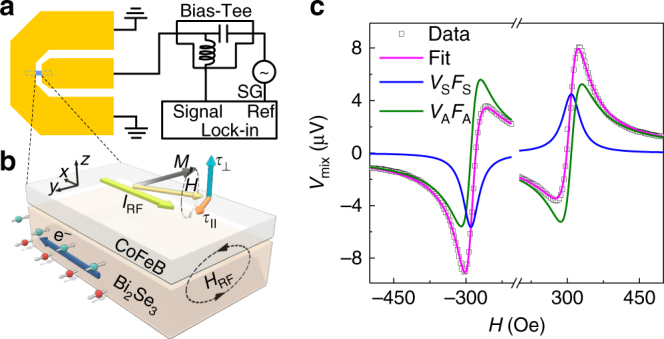
ST-FMR measurements and signals with fits. a Schematic diagram of the ST-FMR measurement setup, illustrating a ST-FMR device and the measurement circuit. An rf current from a signal generator (SG) is injected into the ST-FMR devices via a bias-tee. b Illustration of spin momentum locking and SOT-induced magnetization dynamics in the ST-FMR measurements. The big blue arrow denotes the electron moving direction (opposite to I RF direction). The arrows with green and red balls denote the spin angular momentum generated at top and bottom surfaces of Bi2Se3, respectively. c A typical ST-FMR signal (open symbols) from a Bi2Se3 20 QL/CFB 7 nm device at 6 GHz with fits (solid lines), where the blue and green lines represent the symmetric Lorentzian (V S F S) and antisymmetric Lorentzian (V A F A) components, respectively
