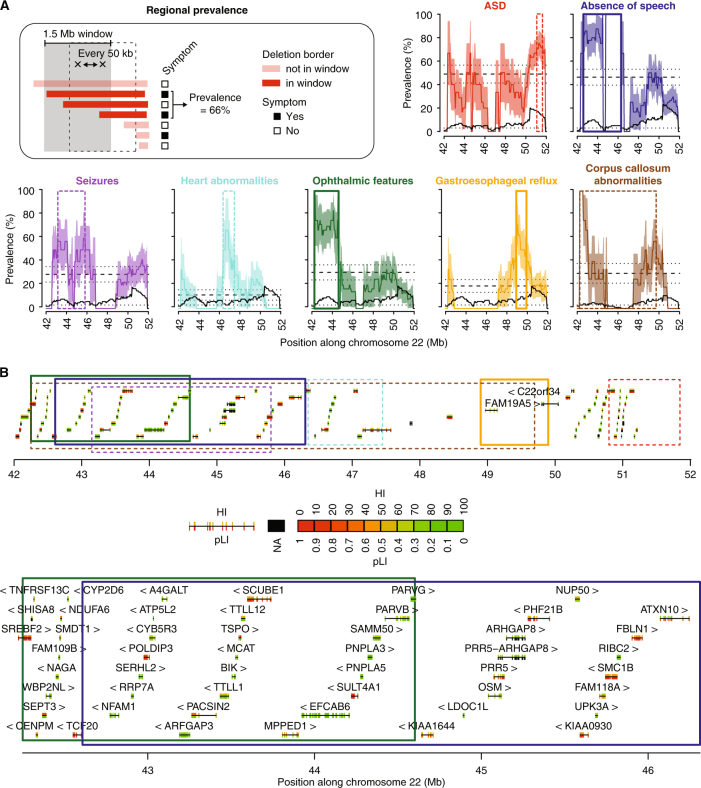
Fig. 3.
Mapping of genomic regions at 22q13 associated with high risk of presenting clinical features. a Prevalence is measured each 50 kb, within overlapping windows of 1.5 Mb (Materials and Methods). Dashed lines represent the global prevalence of each feature, measured as the fraction of patients with 22q13 deletions presenting the feature over all patients with 22q13 deletions. Dotted lines and colored areas represent standard errors of the proportion. Black solid lines show the numbers of informative patients for each window, and black dotted lines correspond to the minimum number of individuals required by window (n = 3) to reduce interpretation biases. b The 22q13 region is represented with the genes (block: exon, line: intron, arrow: strand) and the regions corresponding to a higher than global prevalence for each feature (top). Regions significantly associated with absence of speech and ophthalmic features are also shown in more details (bottom). HI haploinsufficiency, pLI probability of loss-of-function intolerance. Color code similar to a

