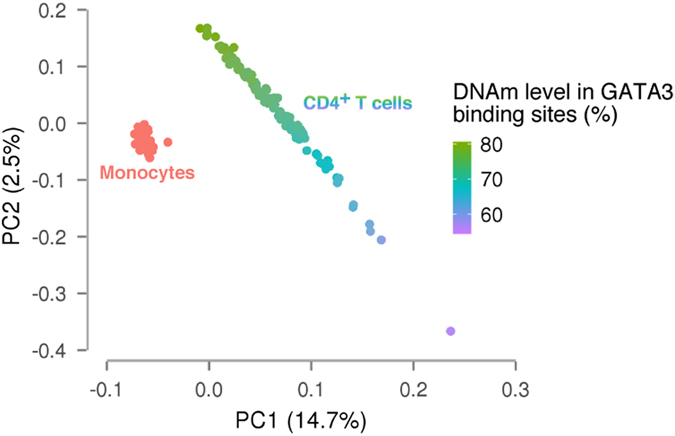
Fig. 2.

PC analysis of comprehensive DNAm profiles. The x-axis and y-axis represent the first and second PC, respectively. Monocytes are indicated in red, while CD4+ T cells are indicated with a colour gradient according to the median DNAm level of GATA3 binding sites, ranging from low (purple) to high (green). GATA3 is involved in the specification of naive CD4+ T cells to Th2 cells and therefore, the median DNAm level of GATA3 binding sites is expectedly negatively correlated with the proportion of Th2 cells
