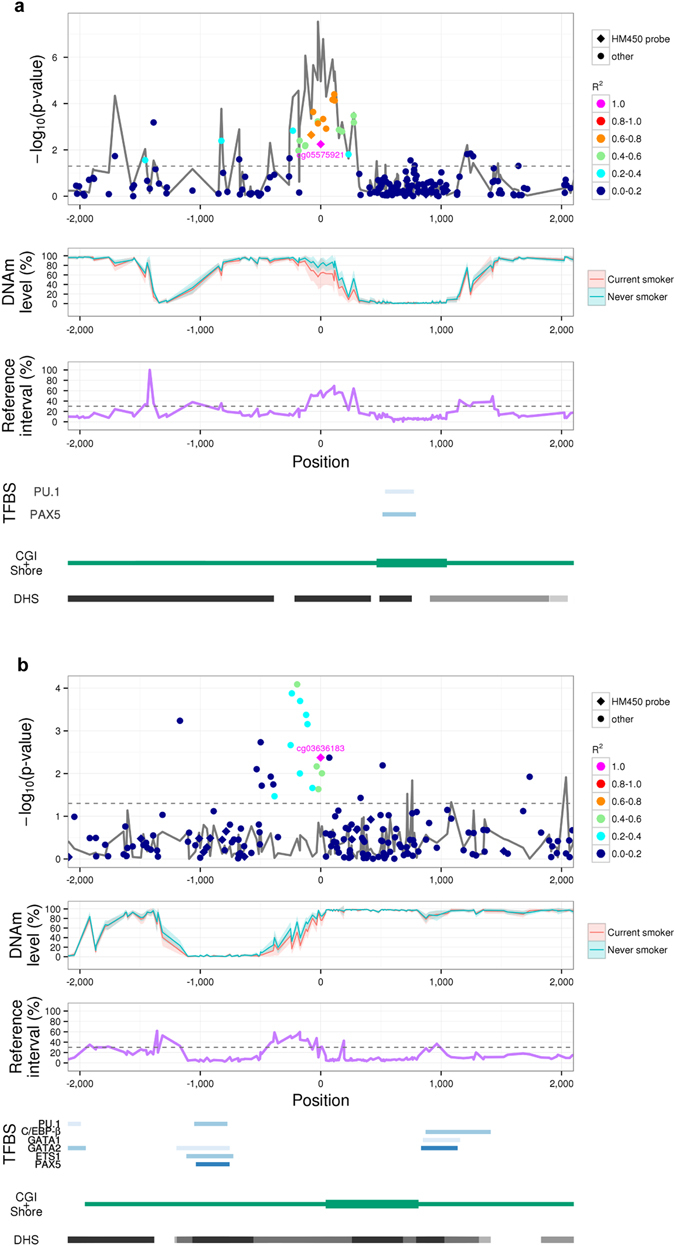
Fig. 4.

Regional analyses of DNAm variability surrounding established DNAm biomarkers. The x-axis indicates the position relative to the DNAm biomarkers cg05575921 in the AHRR locus a and cg03636183 in the F2RL3 locus b. The y-axis represents –log10(P), where P is the P-value for associations between DNAm levels and smoking status (i.e., current smokers vs. never smokers) (First panel). CpGs included in the HM450 probe set are represented by diamonds, and other CpGs are represented by circles. Colours indicate the correlation (R 2) of the DNAm levels with the biomarker CpGs. The solid grey line represents P-values for associations between DNAm and gene-expression levels. The dotted grey line indicates P = 0.05. The y-axis reflects the DNAm level(Second panel). The solid red and blue lines indicate the average DNAm levels observed in current and never smokers, respectively. Standard deviations of the DNAm levels are shown as shaded areas. The y-axis reflects reference intervals (Third panel). The dotted grey line indicates y = 30%. Genomic locations of binding sites for lineage-determining TFs, CGIs, CGI shores and DHSs are shown (Fourth panel). CGI CpG island, DNAm DNA methylation, DHS DNase I-hypersensitive site, HM450 HumanMehylation450, TFBS transcription factor binding site
