Fig. 5.

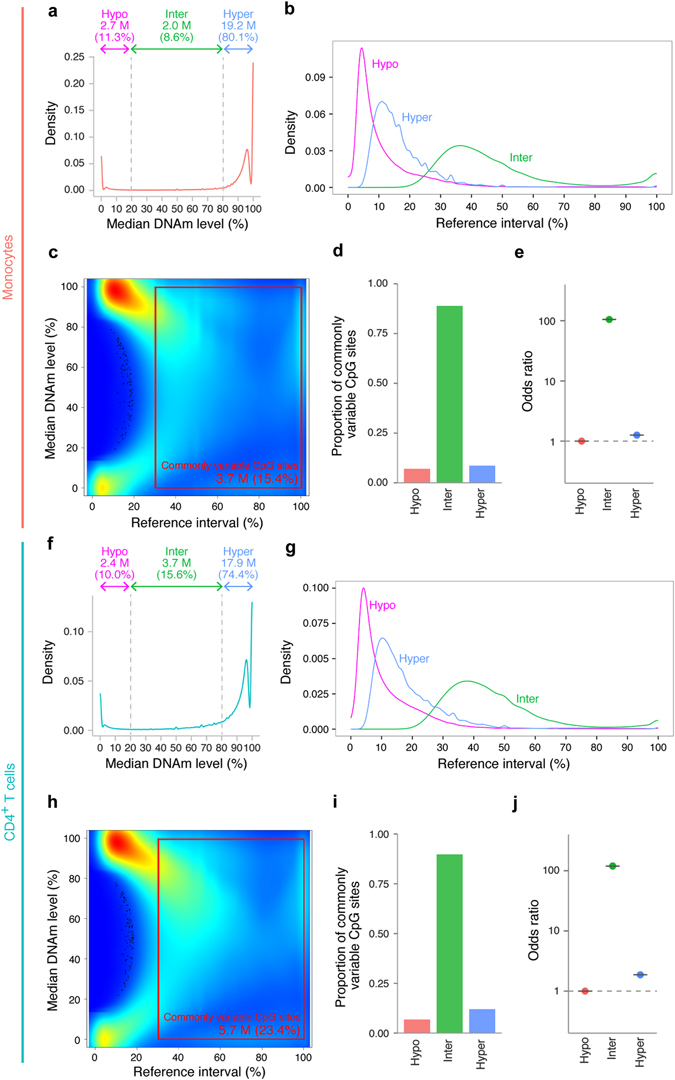
Intermediately methylated CpG sites exhibit large DNAm variability. a Distribution of median DNAm levels in monocytes. b Distributions of reference intervals in monocytes for hypomethylated (red), hypermethylated (blue), and intermediately methylated (green) CpG sites. c CpG-density plot in monocytes. The x-axis represents reference intervals, and the y-axis indicates median DNAm levels. Density is indicated with a colour gradient, ranging from low (blue) to high (red). d Proportions of commonly variable CpG sites in monocytes. e OR in monocytes. The OR was estimated by comparing the proportion of commonly variable CpG sites in hypomethylated, hypermethylated and intermediately methylated CpG sites. The proportion of commonly variable CpG sites in hypomethylated CpG sites is used as the reference. The 95% reference intervals are represented as black lines. f Density plot of median DNAm level in CD4+ T cells. g Distribution of reference intervals in CD4+ T cells. h CpG-density plot in CD4+ T cells. i Proportions of commonly variable CpG sites in CD4+ T cells. j OR in CD4+T cells. Hyper hypermethylated CpG sites, Hypo hypomethylated, CpG sites Inter intermediately methylated CpG sites, M million
