Fig. 1.
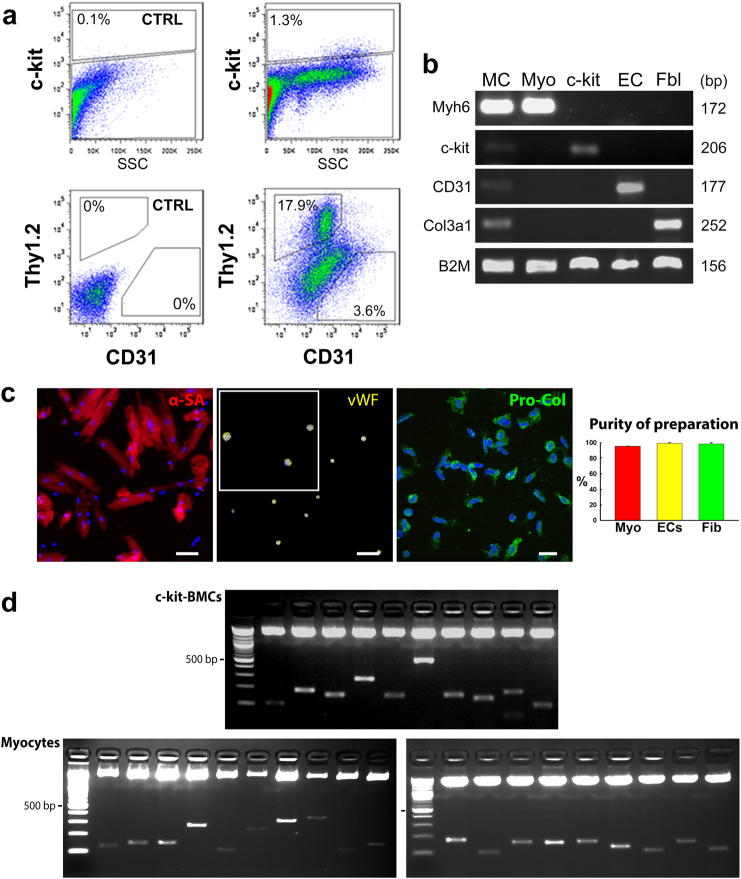
c-kit-BMCs acquire distinct cardiac cell phenotypes in vivo. a Representative scatter plots illustrating the expression of c-kit, Thy1.2 and CD31 in cardiac cell populations isolated from c-kit-BMC-treated infarcted hearts. The percentage of positive cells is indicated. CTRL: isotype control; SSC: side scatter. b Transcripts for α-myosin heavy chain (Myh6), c-kit, CD31, collagen type III α-1 (Col3a1) and β-2 microglobulin (B2M) in isolated cardiomyocytes (Myo), c-kit-BMCs (c-kit), endothelial cells (ECs) and fibroblasts (Fbl). Myocardium (first lane, MC) was used as control. bp: base pairs. c Isolated cardiomyocytes expressing α-sarcomeric actin (α-SA, red), ECs expressing von Willebrand factor (vWF, yellow) and fibroblasts expressing procollagen (Pro-Col, green) are shown. Quantitative data are presented as mean ± SD. Scale bars: Left and central panels = 50 µm; Right panel = 20 µm. d PCR products run on agarose gel correspond to the sites of integration of the viral genome in the DNA of c-kit-BMCs and myocytes. These images correspond to representative examples of experiments conducted in 8 mice. The upper band shows the pCR4-TOPO TA vector. Molecular mass: 100 bp incremental ladders

