Fig. 4.
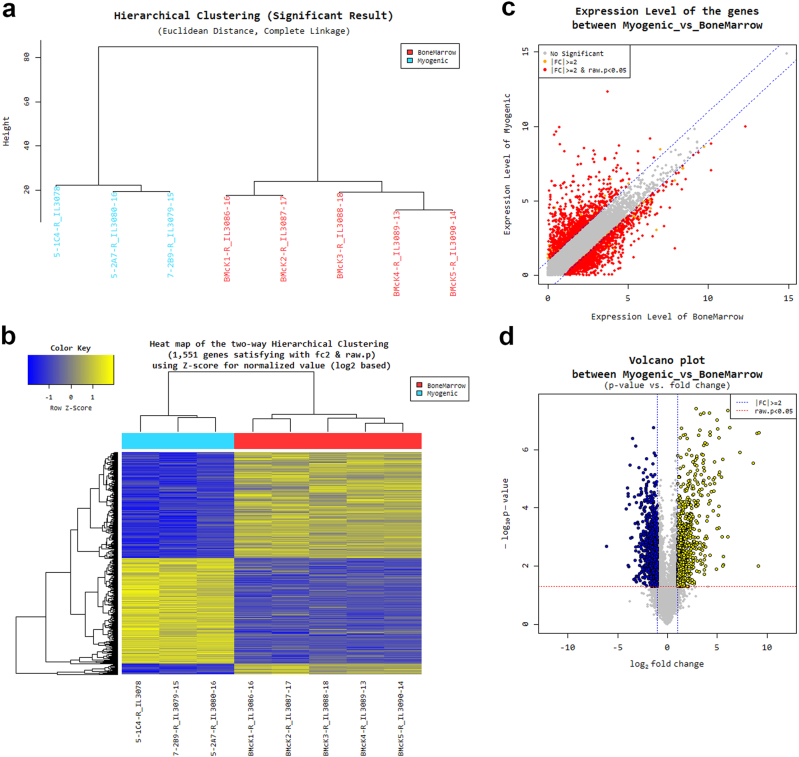
RNA sequencing of myogenic clonal c-kit-BMCs and whole c-kit-BMCs. a Hierarchial clustering analysis of differentially expressed genes (DEGs) in myogenic clonal c-kit-BMCs (myogenic, blue) and whole c-kit-BMCs (Bone marrow, red). b Heatmap of the two-way hierarchical clustering (see panel a) representing graphically the similarity of gene expression patterns between samples. c Scatter plot representing gene expression levels in the two cell groups. The statistical significance (P < 0.05) of the fold change (FC) difference is indicated. d Volcano plot representing gene expression levels in the two cell groups

