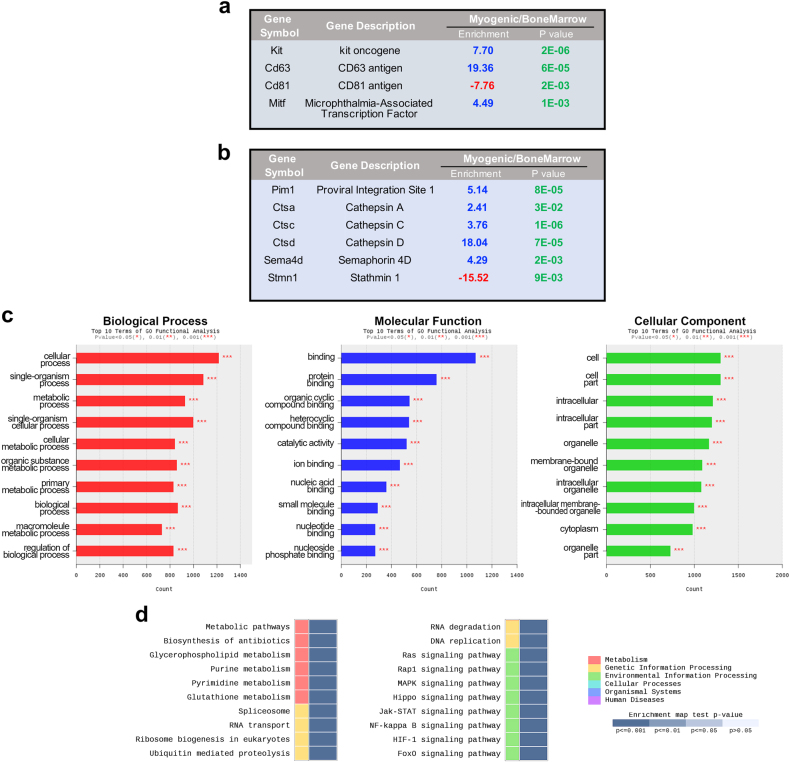
Fig. 5.
Gene expression profile of myogenic c-kit-BMCs. a, b Selected DEGs (see text for detail) in myogenic c-kit-BMCs and whole c-kit-BMCs. c Top 10 terms of GO functional analysis for the three categories: biological process, molecular function and cellular component. d Enrichment map (KEGG database) of annotated gene sets in myogenic c-kit-BMCs vs. whole bone marrow. The color gradient shows the range of P-values; the top 20 gene sets are included (for the complete map, see Supplementary Fig. S3)

