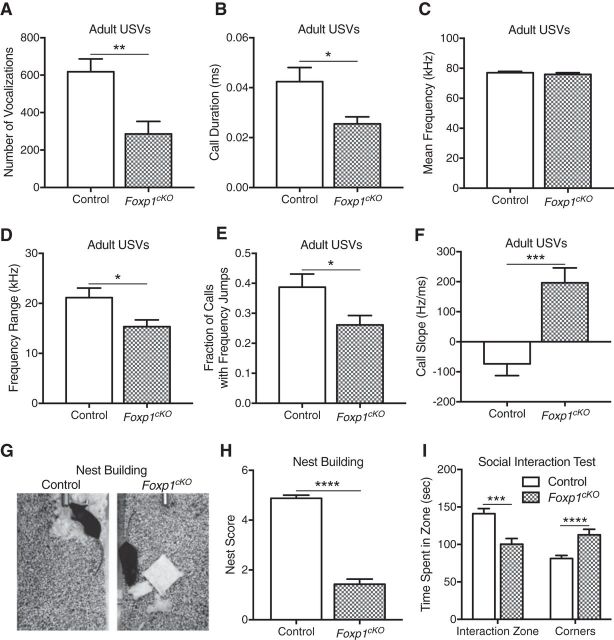
Figure 3.
Impaired social communication in Foxp1cKO mice. A, Adult Foxp1cKO male mice produce fewer total numbers of USVs in a mating paradigm. Data are represented as means ± SEM. n = 13 control mice; n = 15 Foxp1cKO mice. **p = 0.0019, Student's t test, compared between genotypes. B, Foxp1cKO mice exhibit a significant reduction in their mean call duration. Data are represented as means ± SEM. n = 13 control mice; n = 14 Foxp1cKO mice. *p = 0.011, Student's t test, compared between genotypes. C, Foxp1cKO mice show no differences in their mean call frequencies. Data are represented as means ± SEM. n = 13 control mice; n = 14 Foxp1cKO mice. p = 0.45, Student's t test, compared between genotypes. D, Adult Foxp1cKO male mice produce USVs with smaller frequency ranges. Data are represented as means ± SEM. n = 13 control mice; n = 14 Foxp1cKO mice. *p = 0.019, Student's t test, compared between genotypes. E, Foxp1cKO mice produce a smaller fraction of USVs with frequency jumps. Data are represented as means ± SEM. n = 13 control mice; n = 15 Foxp1cKO mice. *p = 0.025, Student's t test, compared between genotypes. F, Foxp1cKO mice show a significant difference in the average slope of their USVs. Data are represented as means ± SEM. n = 13 control mice; n = 14 Foxp1cKO mice. ***p = 0.0003, Student's t test, compared between genotypes. G, Representative photographs of the nests produced by littermate control and Foxp1cKO mice. H, Foxp1cKO mice produce nests with low-quality scores. Data are represented as means ± SEM. n = 8 control mice; n = 7 Foxp1cKO mice. ****p < 0.0001, Student's t test, compared between genotypes. I, Foxp1cKO mice are less social than their littermate controls, as determined by the decreased time they spend interacting with a sex-matched conspecific (time in interaction zone). Data are represented as means ± SEM. n = 16 control mice; n = 12 Foxp1cKO mice. **p < 0.01, ***p < 0.001, Student's t test, compared between genotypes.

