Figure 1.

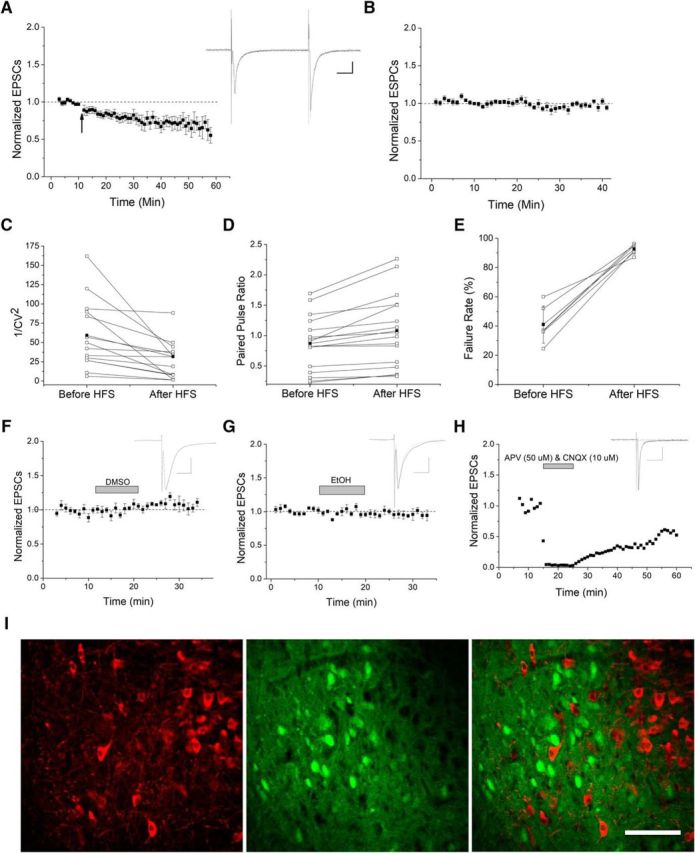
Presynaptic LTD in VTA GABA cells. A, Glutamate currents recorded from GAD67-GFP-positive VTA GABA cells. The 100 Hz HFS induces LTD as EPSC responses were reduced by 21 ± 5.5% at 10–15 min after HFS compared with baseline (n = 14, p ≪ 0.05, baseline compared with postconditioning at 10–15, 15–20, and 20–25 min) and eventually reached >30% depression. All plots are normalized EPSC amplitude means with standard error of the mean (SEM). Arrow indicates 100 Hz HFS conditioning induction. Insets, Here and throughout, Representative averaged EPSC traces (10–12 traces) taken from before (black) and 10–15 min after conditioning or drug application (gray). Calibration: Scale bars here and throughout are 100 pA, 10 ms. B, No treatment controls showed no change in EPSC amplitude, which demonstrates that HFS-LTD is not due to rundown effect (n = 8). C–E, Following HFS, the 1/CV2 decreased (n = 13 p < 0.05), PPR increased (n = 15, p < 0.05), and failure rates increased (n = 6, p < 0.05), suggesting a presynaptic mechanism for HFS-LTD. Connected open circles represent individual experiments before and 5–10 min after HFS. Connected closed circles represent averages from all experiments. F–H, Vehicle controls and glutamate transmission confirmation. F, Solvent DMSO vehicle controls demonstrate that DMSO does not alter basal neurotransmission of VTA GABA cells (n = 6, p > 0.5, post-DMSO application compared with pre-DMSO). G, EtOH vehicle controls also demonstrate no change in EPSCs compared with baseline (n = 7, p > 0.5). H, An individual experiment denotes that recorded EPSCs are indeed glutamatergic as they are blocked by a combination of AMPA receptor antagonist CNQX and NMDA receptor antagonist APV (n = 5). Washout occurs and recovers some of the glutamate response. I, Immunohistochemical image of the VTA. GAD67-GFP-positive mice were counterstained with TH antibody to label dopaminergic neurons. Anti-TH antibodies label cytosol of dopaminergic neurons as noted in the red channel, whereas GAD67-GFP-positive neurons are labeled in the green channel. In the merged image, no individual neuron is double-labeled, indicating that the inhibitory cells we recorded from are not dopaminergic, but that both are separate cell populations. Scale bar, 100 μm.
