Figure 1.
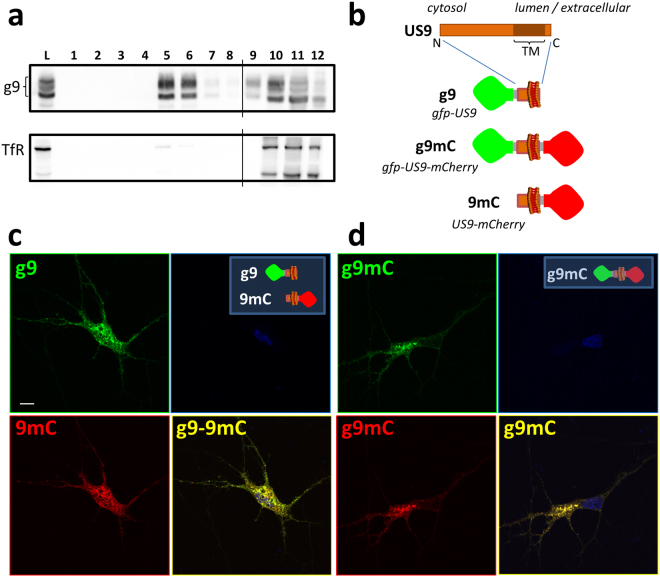
Topological organization and intracellular distribution of US9-driven fluorescent cargos. (a) Electrophoretic analysis of proteins from 293T cells expressing gfp-US9 (g9). Cells were solubilized in the presence of cold Triton X100, and separated on Optiprep density gradient. The presence of g9 was detected on each fraction with an antibody against gfp (top gel) and compared to the distribution of the endogenous Transferrin Receptor (TfR) in the bottom gel. Total cell lysates (L) patterns are shown on the first lane, and sequential fractions collected from top are loaded in lanes 1–12. gfp-US9 accumulation in fractions 5–6 indicates its association with lipid rafts. Fractions were loaded on two gels, as indicated by the vertical line between lanes 8 and 9 of each blot. The full-length blots are presented in the Supplementary material (S5). (b) Schematic description of the US9 chimeric constructs generated through modifications of the N- and C-terminus. The US9 membrane orientation determines the exposure of gfp and mCherry on the cytosolic and lumenal/extracellular side of the membrane, respectively. (c,d) Confocal images of rat neurons showing the intracellular localization of the US9-based fluorescent probes described in (b). g9 and 9mC fluorescent patterns were analyzed in (c), and their distributions merged in g9-9mC reveal a similar behavior of the two differently oriented constructs. A punctate staining is also obtained in cells expressing the double reporter g9mC (d), with a distribution indistinguishable from that of gfp-US9. Scale bar is 10 μm.

