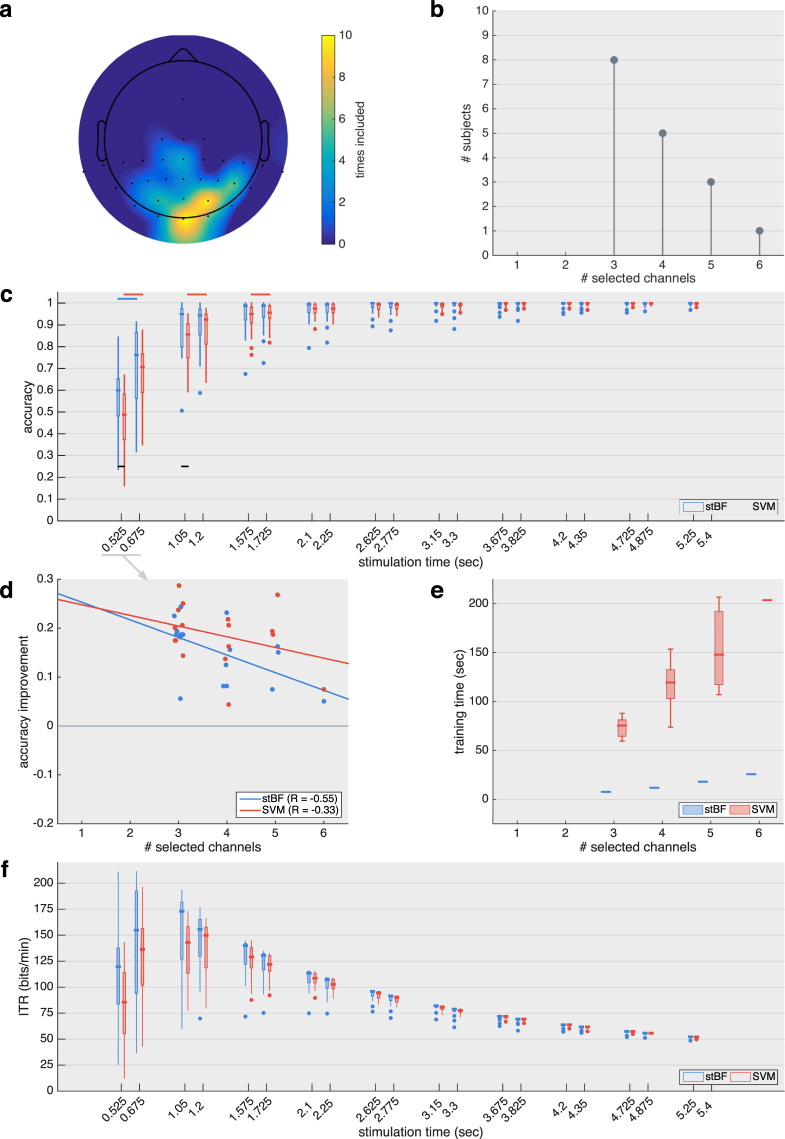
Figure 5.
Results for the session adopting the 120 Hz stimulus rate. (a) Scalp plot indicating how many times each channel was selected by the greedy channel-selection algorithm across subjects. Note that most of the frontal and temporal area was not recorded during the experiment. (b) Summary of the total number of channels selected by the greedy channel-selection algorithm before convergence. (c) Target identification accuracy for both classifiers with an increasing number of repetitions of the stimulation m-sequence (1 sequence = 0.525 sec), with and without the exclusion of the initial 150 ms of each epoch. Black horizontal lines indicate significant differences between the classifiers. Blue and red horizontal lines indicate significant differences when excluding the first 150 ms. (d) Regression analysis of the increase in target identification accuracy based on one repetition of the m-sequence when excluding the first 150 ms. (e) Time needed to train the classifiers on all data of each subject. (f) Virtual ITR achieved when factoring in 0.5 seconds for gaze shifting.

