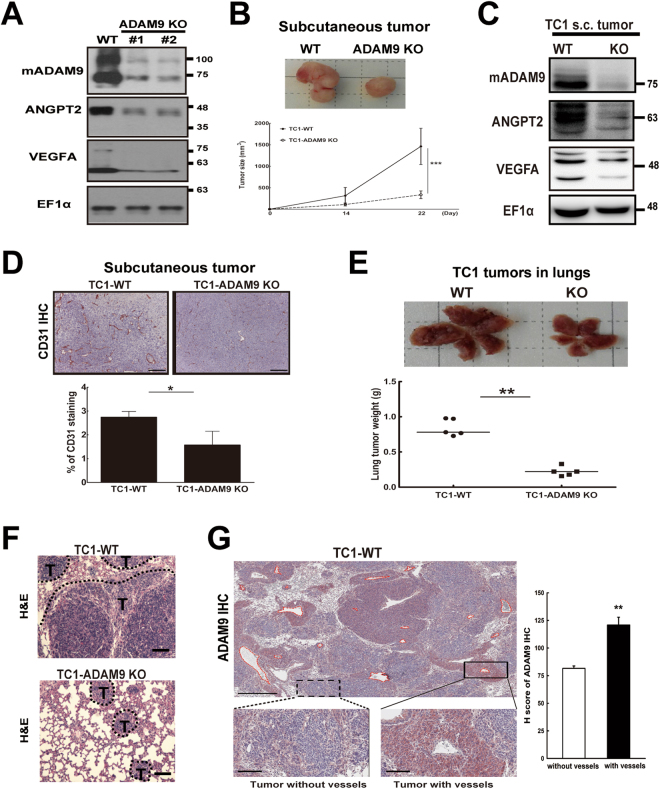
Figure 4.
ADAM9 knockout significantly inhibits tumor growth and metastasis in vivo. (A) Western blot of ADAM9 knockout in mouse lung cancer TC1 cells. WT, wild-type; #1 and #2 represent two independent stable clones with ADAM9 knockout. (B) Wild-type (n = 7) or ADAM9 knockout (n = 7) TC1 cells were injected subcutaneously into C57BL/6 mice. The photograph (top) shows subcutaneous tumors removed from each group after sacrifice; the graph (bottom) shows the quantification of tumor volume at the indicated days after inoculation. (C) Western blot of ADAM9, ANGPT2, and VEGFA from subcutaneous (s.c.) tumors of each group. (D) Tumor tissues were processed for IHC staining of CD31. The images were magnified at 100x (top, scale bar 200 μm). CD31 staining was quantified as the percentage of positively stained density (bottom). (E) WT (n = 5) and ADAM9 KO (n = 5) TC1 cells were injected intravenously via the tail vein of mice. The photograph shows metastatic tumors in the lung from each group (top) and the weight of whole lung tumors was measured from the two groups (bottom). (F) Metastasis in the lung from WT or ADAM9 KO TC1 cells injection intravenously appeared as dense tumor clusters (T) following hematoxylin and eosin staining (H&E). (G) Lung tumor tissues were processed for IHC staining of ADAM9. Images were scanned with Aperio software; digital resolution is 0.5 μm per pixel. Scale bar is 500 μm. Vessels were highlighted by red broken line (left, upper). The representative images of ADAM9 staining in tumor with or without vessels were showed (left, lower). The scale bar is 100 μm. The intensities of ADAM9, H score, were quantified by Aperio ImageScope software program (right). *P < 0.05, **P < 0.01, ***P < 0.001.

