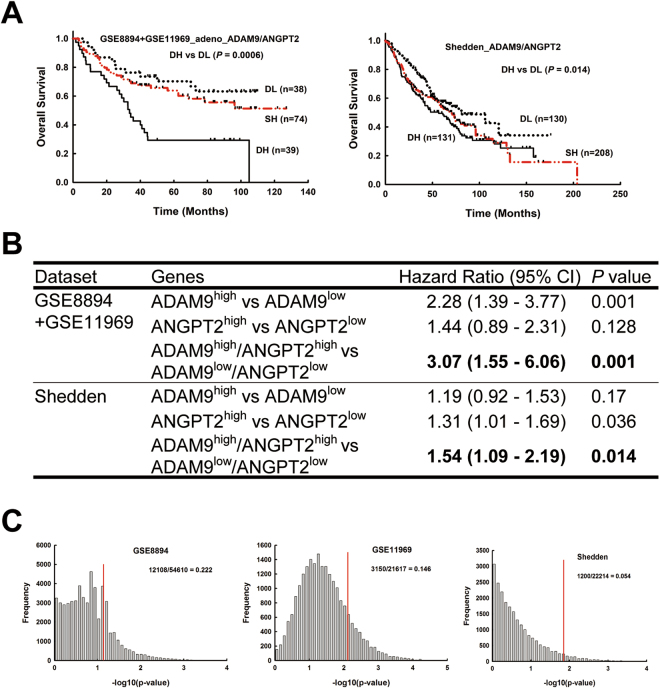
Figure 6.
Simultaneous high expression of ADAM9 and ANGPT2 correlates with poor outcome in lung adenocarcinoma patients. (A) Kaplan-Meier survival analyses of lung adenocarcinoma patients in each indicated data set, with patients categorized by ADAM9 and ANGPT2 gene expression. Labels are defined as in Fig. 5. (B) Cox proportional hazards regression analyses of overall survival in each dataset of lung adenocarcinoma patients, grouped by ADAM9 and ANGPT2 expression. (C) Ranking the P-value of ADAM9 plus ANGPT2 among all P-values of profile genes by combining a fixed predictor with the other randomly selected genes from the same dataset. Fixed predictor: ADAM9 in the GSE8894 and GSE11969 datasets and ANGPT2 in the Shedden dataset. The P-value of ADAM9high/ANGPT2high versus ADAM9low/ANGPT2low is marked by the red line.

