Fig. 1.
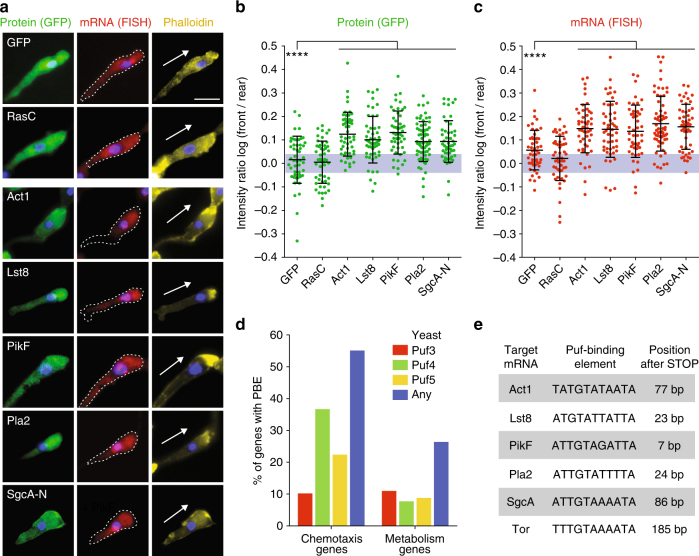
Four chemotaxis pathway mRNAs and proteins localize to the cell front in chemotaxis. a Localization of GFP-tagged proteins and corresponding mRNAs in cells expressing GFP-RasC, -Act1, -Lst8, -PikF, -Pla2, the N-terminal 1019 residues of SgcA (SgcA-N) and GFP control in natural chemotactic streams. Chemotaxis pathway genes were expressed with their endogenous 3′-UTRs. Arrow indicates orientation of cell polarity defined by F-actin stain (Alexa Fluor 647-conjugated Phalloidin). DNA (nucleus) was stained with DAPI. Note that some GFP-mRNAs were also localized in bright foci within the nucleus, which represent sites of transcription. Scale bar, 10 μm. b, c Quantification of the fluorescence intensity ratio of each GFP-tagged protein and mRNA between the front and rear of the cell, and represented as a log of the log F/R. The gray area indicates values equivalent to symmetric localization (between log(0.9) and log(1.1)). Mean and standard deviation (SD), n ≥ 50 cells. Mann–Whitney test: ****p < 0.0001. d Percentage of genes annotated with the function “chemotaxis” (97 genes) or “metabolism” (57 genes) in Dictybase with PBEs defined by consensus sites for yeast Puf3, Puf4, Puf5 or any of them within 330 base pairs after STOP codon (Supplementary Fig. 2). e Pumilio-binding elements (PBEs) in the 3′-UTR of genes involved in chemotaxis

