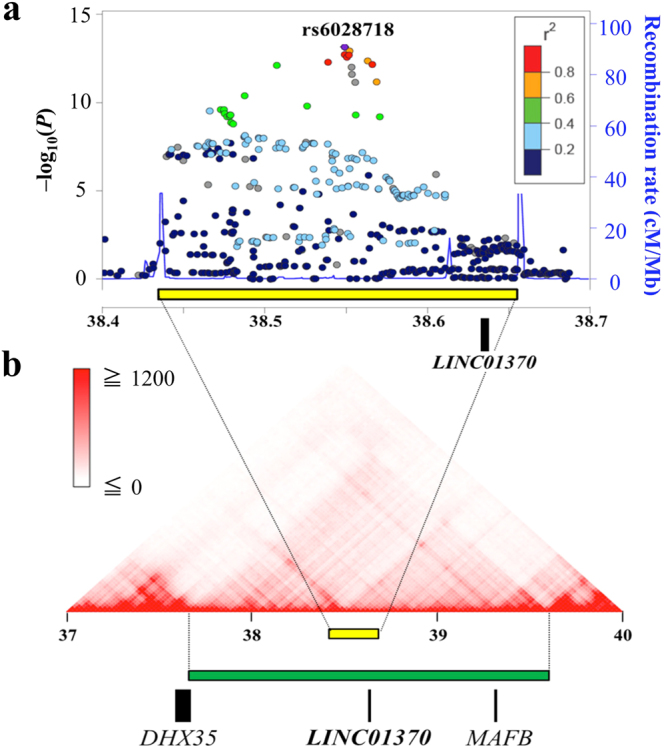
Figure 2.

Evaluation of the 20q12 locus (a) Regional association plot derived from the GWAS result of imputation analysis for idiopathic osteonecrosis of the femoral head. The region surrounded by distinct peaks of recombination rate (yellow box) was identified as a disease susceptibility locus. Only LINC01370 was within this locus. The color intensity reflected the extent of linkage disequilibrium index (r 2) with rs6028718 (in purple). Estimated recombination rates from the hg19/1000 Genomes Project Nov 2014 East Asian reference were shown as light-blue lines. (b) The topologically associated domain around the 20q12 locus (green box). Aside from LINC01370, this domain contained DHX35 (DEAH-box helicase 35) and MAFB (MAF bZIP transcription factor B).
